Project
Optio.News
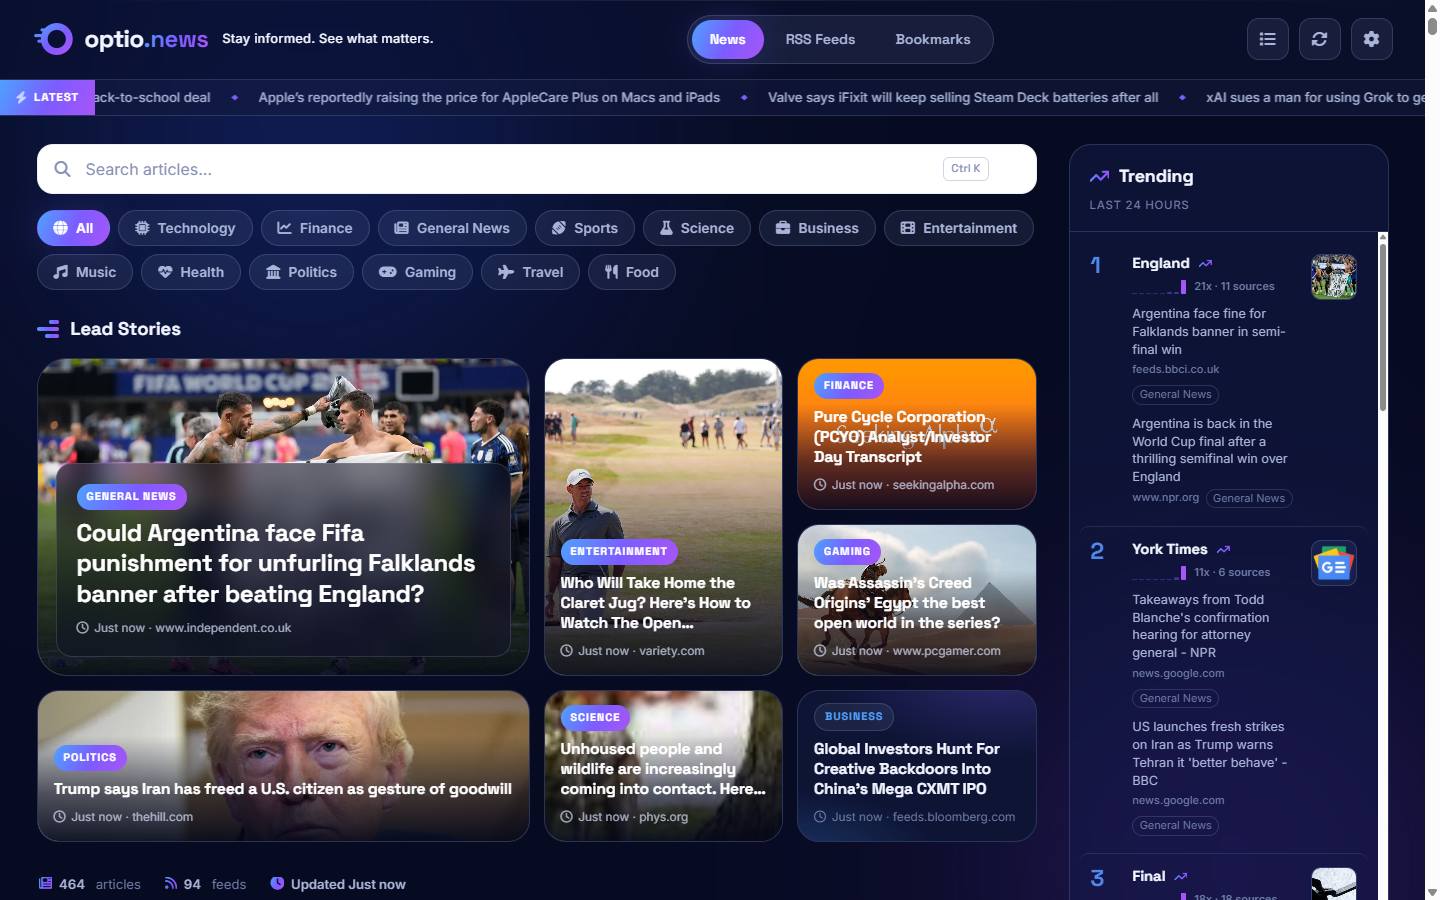
Optio.News aggregates 94 sources across 13 categories into an editorial, photography-led reading experience. I designed, built, and operate the full stack: a parallel crawl pipeline, article-page image enrichment, statistically grounded trend detection, and an adaptive card interface, all running as a single Flask service.
The short version
Optio.News began as a personal answer to fragmented news reading: one place aggregating the sources I trust, with per-user feed control and bookmarking. The functional version worked, but read like a database dump. It used uniform text cards, carried little imagery, surfaced noisy word fragments as trends, and could leave a visitor waiting for minutes while more than 90 feeds loaded serially.
I rebuilt it as an editorial product. The key move was recognizing that the interface could only ever be as good as the data feeding it. I parallelized the crawl, recovered missing imagery from article pages, sanitized junk metadata, and rebuilt trending around entity merging, source diversity, and burst detection. The interface now adapts to what each article actually contains instead of forcing every story into the same box.
| Result | Measurement |
|---|---|
| 98% of articles carry real photography | Up from about 60%; measured at 328 of 336 live articles |
| Instant first paint at any cache state | Replaced a multi-minute blocked load |
| 56/56 tests passing on every deploy | Suite runtime reduced from 35 seconds to 17 seconds |
| 94 sources across 13 categories | Roughly 450 articles per refresh |
The challenge: syndication data fights good design
Three compounding problems defined the work.
The imagery problem
Roughly 40% of aggregated articles carried no usable image in their RSS metadata. Entire high-volume sources such as TechCrunch supplied none at all. A genuinely image-forward design was impossible on top of that data.
A live snapshot found RSS-supplied imagery on only 207 of 344 articles.
The cold-start problem
The crawler fetched approximately 94 feeds serially. On a fresh deploy, the first visitor’s request blocked behind the entire crawl, making the page appear not to load. Server logs showed the background cache warmer and first page request running the same serial crawl concurrently. The hang was self-inflicted duplication, not simply slow sources.
The trending problem
Frequency counting made “trending” meaningless. Capitalized sentence starters masqueraded as proper nouns, name fragments ranked separately from their entities, and perennial topics dominated every day regardless of whether they were actually gaining attention.
Problem statement: Make unreliable third-party syndication data support a premium editorial experience without adding infrastructure, frameworks, or cost.
Constraints: One small server, no CDN, no queue, no search service, no client framework, additive-only schema changes, and no fabricated UI states or engagement metrics.
Key insight
Every visible quality problem traced back to the data layer. Fix the pipeline once, and the design system, hero, and trending experience all improve with it.
Before and after
| March 2026 build | July 2026 build |
|---|---|
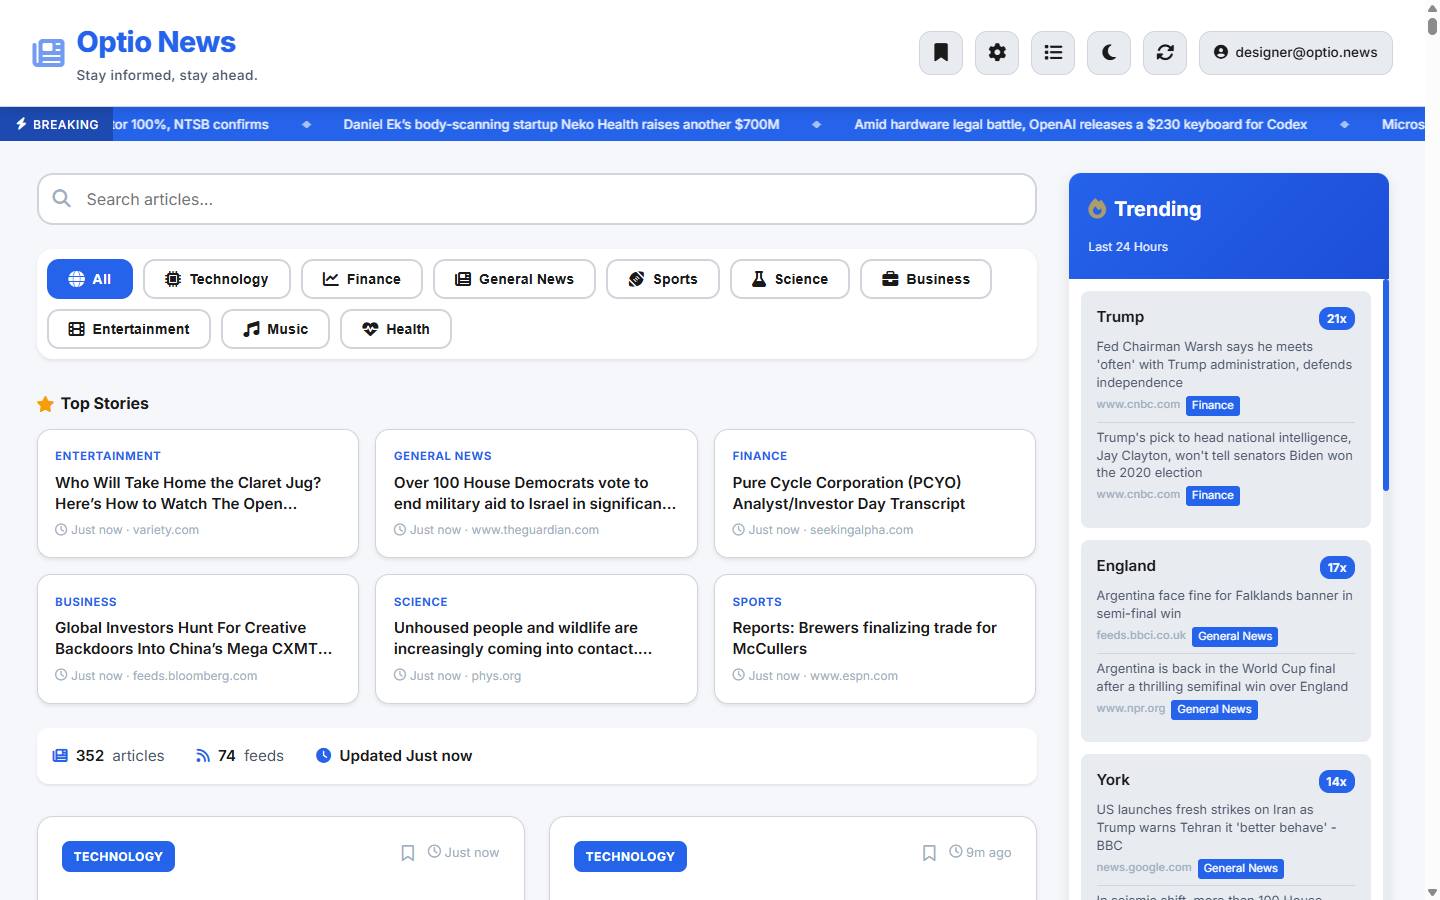 |
|
| Uniform text cards, almost no imagery, and a trending list showing the “York” fragment bug. | The same account and viewport using live feeds. The lead mosaic, card variety, and merged trend entities are pipeline-driven. |
The solution: four connected systems
1. Parallel, self-healing ingest
A 12-worker thread pool crawls every feed with per-socket timeouts. A single-flight lock ensures only one crawl runs process-wide. Articles missing imagery enter a second parallel pass that fetches their pages and extracts og:image or twitter:image metadata. That pass is capped and time-boxed so a slow publisher cannot stall the refresh.
One live run recovered 101 of 108 missing images, raising coverage from about 60% to 98%.
2. Honest loading
During the single cold crawl after a deploy, the API responds immediately with a warming flag. The page paints skeleton cards, explains that feeds are warming up, polls for completion, and then fills the hero, ticker, and trending panel. A multi-minute hang became an instant first paint followed by a transparent 30-60 second warm-up once per deploy.
3. Content-aware editorial UI
The card system includes hero, wide-cinematic, portrait, headline-first, and compact-row treatments. It selects a presentation from the article’s actual image, aspect ratio, summary quality, and placement. A seven-slot asymmetric hero mosaic gives image-rich stories the largest positions.
The visual identity uses a clear-glass, midnight-navy system derived from the brand logo, with four elevation levels, a focused blue-to-violet gradient, reduced-motion support, and keyboard-accessible controls.
4. Statistically grounded trending
Recurring capitalized pairs merge into entities, so “Todd Blanche” does not compete with “Blanche.” Topics appearing across many outlets outrank single-outlet repetition, mentions from the previous six hours receive more weight, and persisted daily counts let the system score a topic’s burst above its own seven-day baseline instead of relying on raw frequency.
The interface exposes only computed signals: real 24-hour sparklines from publication timestamps, source counts, rank movement, and click-to-filter behavior. Results are memoized per cache generation rather than recomputed on every request.
How the pipeline fits together
- A 12-worker crawler fetches 94 RSS feeds with strict socket timeouts.
- Entries are parsed and available media is extracted.
- Missing images trigger a bounded article-page metadata lookup.
- Results enter a 30-minute cache protected by a single-flight lock.
- The articles API reports whether data is ready or warming.
- The trending engine combines entities, source diversity, recency, and seven-day baselines.
- The adaptive interface chooses the appropriate presentation for each article.
Enrichment happens once per crawl in background threads, never on a user’s request path. Every step can fail per article and falls back to an intentional state, such as a headline-first card or gradient panel, instead of a broken one.
The login is the thesis statement
The first screen needed to communicate that the product is layered, live, and fast. Aurora light fields, drifting glass panes, and the app’s real category chips assemble around a glass sign-in card. The experience includes a complete prefers-reduced-motion fallback, preserves password-manager compatibility, and keeps the form interactive before the animation finishes.
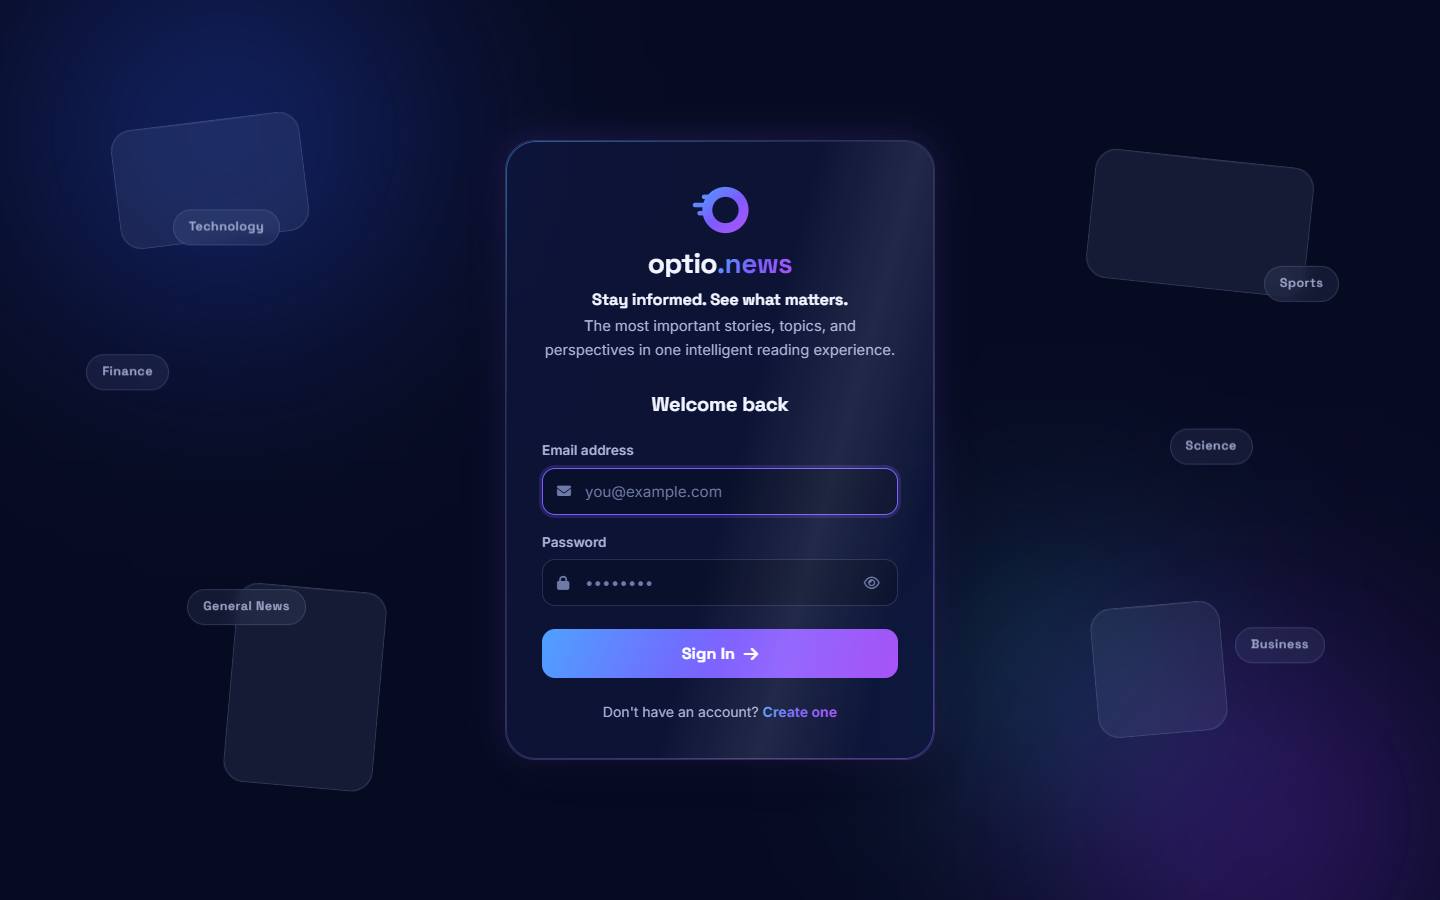
Every floating chip represents a real category from the running application.
Built and verified in increments
The redesign foundation, pipeline changes, navigation and settings improvements, and trending overhaul shipped as reviewable increments. Each was verified through the 56-test pytest suite, automated browser sessions at 1440, 768, and 390 pixel widths, and post-deployment smoke checks against production.
Railway deploys automatically from main. Schema changes remained additive, allowing production to migrate without a disruptive cutover.
Two representative bugs shaped the engineering rules used throughout the project:
- Stylesheets own layout. The bookmarks grid and mobile trending strip both failed because JavaScript assigned inline
displayvalues that overrode media queries. JavaScript now toggles state classes while CSS controls rendering. - Heuristics need guards. Entity merging could initially orphan topics whose phrase did not survive tokenization. A fragment is now suppressed only when its complete parent phrase exists as a candidate.
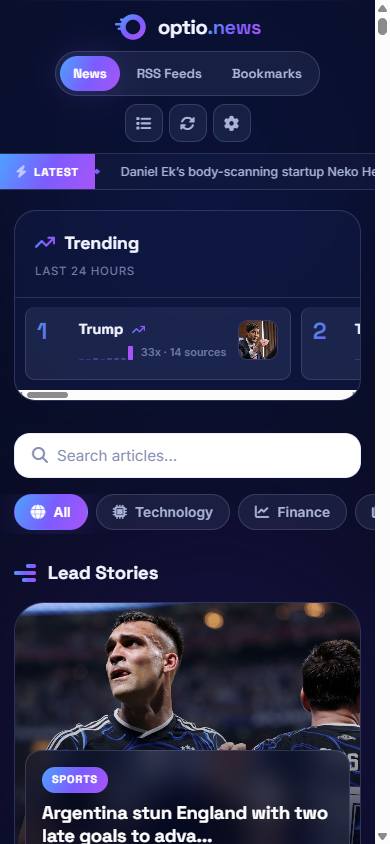
On phones, trending becomes a swipeable strip above the feed instead of being buried below hundreds of articles.
Results
| Dimension | Before | After |
|---|---|---|
| Article image coverage | About 60% (207/344) | About 98% (328/336) |
| Cold-start behavior | Multi-minute blocked load | Instant paint and transparent warm-up |
| Full crawl of 94 feeds | Serial, measured in minutes | Parallel, measured in tens of seconds |
| Trending quality | Stopword and fragment pollution | Merged entities, burst ranking, and source diversity |
| Trending computation | Full re-analysis per request | Memoized per cache generation |
| Test suite | 56 passing in about 35 seconds | 56 passing in about 17 seconds |
No adoption, retention, or satisfaction metrics are claimed because analytics are not yet integrated. Trending improvements were verified through direct inspection of live output before and after, not through a labeled evaluation set. Core Web Vitals measurement remains a planned next step.
What I would carry into the next project
- Data quality is a product feature. The highest-leverage design change was an HTTP lookup for missing
og:imagemetadata. I now audit what the data can support before designing what the interface should show. - Never let JavaScript own what CSS owns. JavaScript should toggle state; stylesheets should decide rendering.
- Honest empty states beat fake fullness. The warming state, headline-first fallbacks, and movement badges that remain hidden until real history exists make the product more trustworthy.
- Heuristics deserve baselines. Frequency is not trend. Persisting per-topic daily counts improved ranking more than another scoring tweak because it gave the algorithm memory.
Reflection
I am most proud that the polish is load-bearing. The hero mosaic, sparklines, and card variety are not decoration bolted onto the data; they are expressions of guarantees built into the pipeline. The hardest discipline was refusing fabrication: no fake breaking-news labels, invented engagement counts, or placeholder testimonials.
Building at high velocity with AI assistance shifted my role toward specification, verification, and judgment. Every increment shipped only after tests and live browser checks, and the bugs that escaped local review were caught by inspecting the running product rather than relying on the diff alone.
Next: Establish a Lighthouse and Core Web Vitals budget, add read-state tracking, then build per-user email digests, adoption analytics, story clustering, and a labeled trending evaluation set.
Visit the live product | Review the source
All metrics on this page were measured against the live system in July 2026; anything unmeasured is labeled as such.