Project
Prisoner’s Dilemma: Algorithmic Modeling & Simulation Research Study
Project overview
The Prisoner’s Dilemma Simulation is a public web application for exploring how decision strategies behave when cooperation and self-interest repeatedly collide. It turns the iterated Prisoner’s Dilemma into an inspectable system: users can run tournaments, compare strategy profiles, play against an algorithm, build a rule-based strategy, and export the resulting data and charts.
The engineering challenge was not simply to calculate a winner. The application needed to keep dozens of stateful strategies isolated, make stochastic behavior reproducible, stream a large tournament through a responsive browser interface, and expose enough evidence for a user to understand why a result occurred.
Open the live simulation · View the source on GitHub
System at a glance
- Runtime: Python with Dash and Plotly
- Simulation engine: 40 built-in strategies behind a consistent strategy interface
- Experiment controls: selected strategies, rounds per match, repetitions, random seed, and whether the match horizon is known
- Live limit: up to 10 strategies in an interactive tournament
- Analysis: leaderboards, cooperation rates, score timelines, match outcomes, profiles, and head-to-head comparisons
- Interaction: human-versus-strategy play and a constrained custom strategy builder
- Exports: CSV data and PNG/PDF charts
- Deployment: Gunicorn on Render
Architecture
The application separates simulation behavior from presentation.
pages/game_logic.py contains the payoff function, strategy implementations, tournament state, deterministic random-number state, aggregation, and human-match logic. The core engine does not depend on Dash components, which keeps strategy behavior testable and prevents UI callbacks from becoming the source of truth.
pages/app.py owns the Dash layout, routing, forms, callbacks, charts, downloads, and product-level limits. It translates user input into simulation state and converts aggregate results into visual explanations.
This boundary matters because the same engine supports two very different execution modes:
- A complete tournament can be calculated as a data frame for analysis.
- A live tournament can advance incrementally so the browser receives progress and chart updates without waiting for the entire experiment.
Simulation model
Each round uses the classic payoff structure:
| Player A | Player B | A points | B points |
|---|---|---|---|
| Cooperate | Cooperate | 3 | 3 |
| Defect | Cooperate | 5 | 0 |
| Cooperate | Defect | 0 | 5 |
| Defect | Defect | 1 | 1 |
A match consists of two strategies playing for a configurable number of rounds. A tournament is a round-robin across the selected strategies, repeated enough times to expose behavior that would be hidden by one stochastic run.
The engine records round-level moves and points while maintaining strategy-level totals, rounds played, cooperation counts, wins, losses, and ties. That gives the UI both detailed evidence and inexpensive aggregates.
Strategy engine
Every strategy receives its opponent’s prior moves and returns cooperate or defect. A fresh state is created for every pairing so memory from one opponent cannot leak into another match.
The 40 built-in strategies include established baselines such as Tit for Tat, Always Cooperate, Always Defect, Win-Stay Lose-Shift, Generous Tit for Tat, Joss, and Prober alongside experimental strategies based on grudges, patterns, number sequences, end-game behavior, and adaptive rules.
Some strategies need to know the total number of rounds. The horizon_known control makes that information explicit. Strategies that do not use the horizon behave the same either way; end-game strategies can alter their final-round decisions only when the experiment permits it.
Responsive incremental execution
A large tournament can involve thousands of rounds. Running all of them inside one browser callback would make the interface appear frozen.
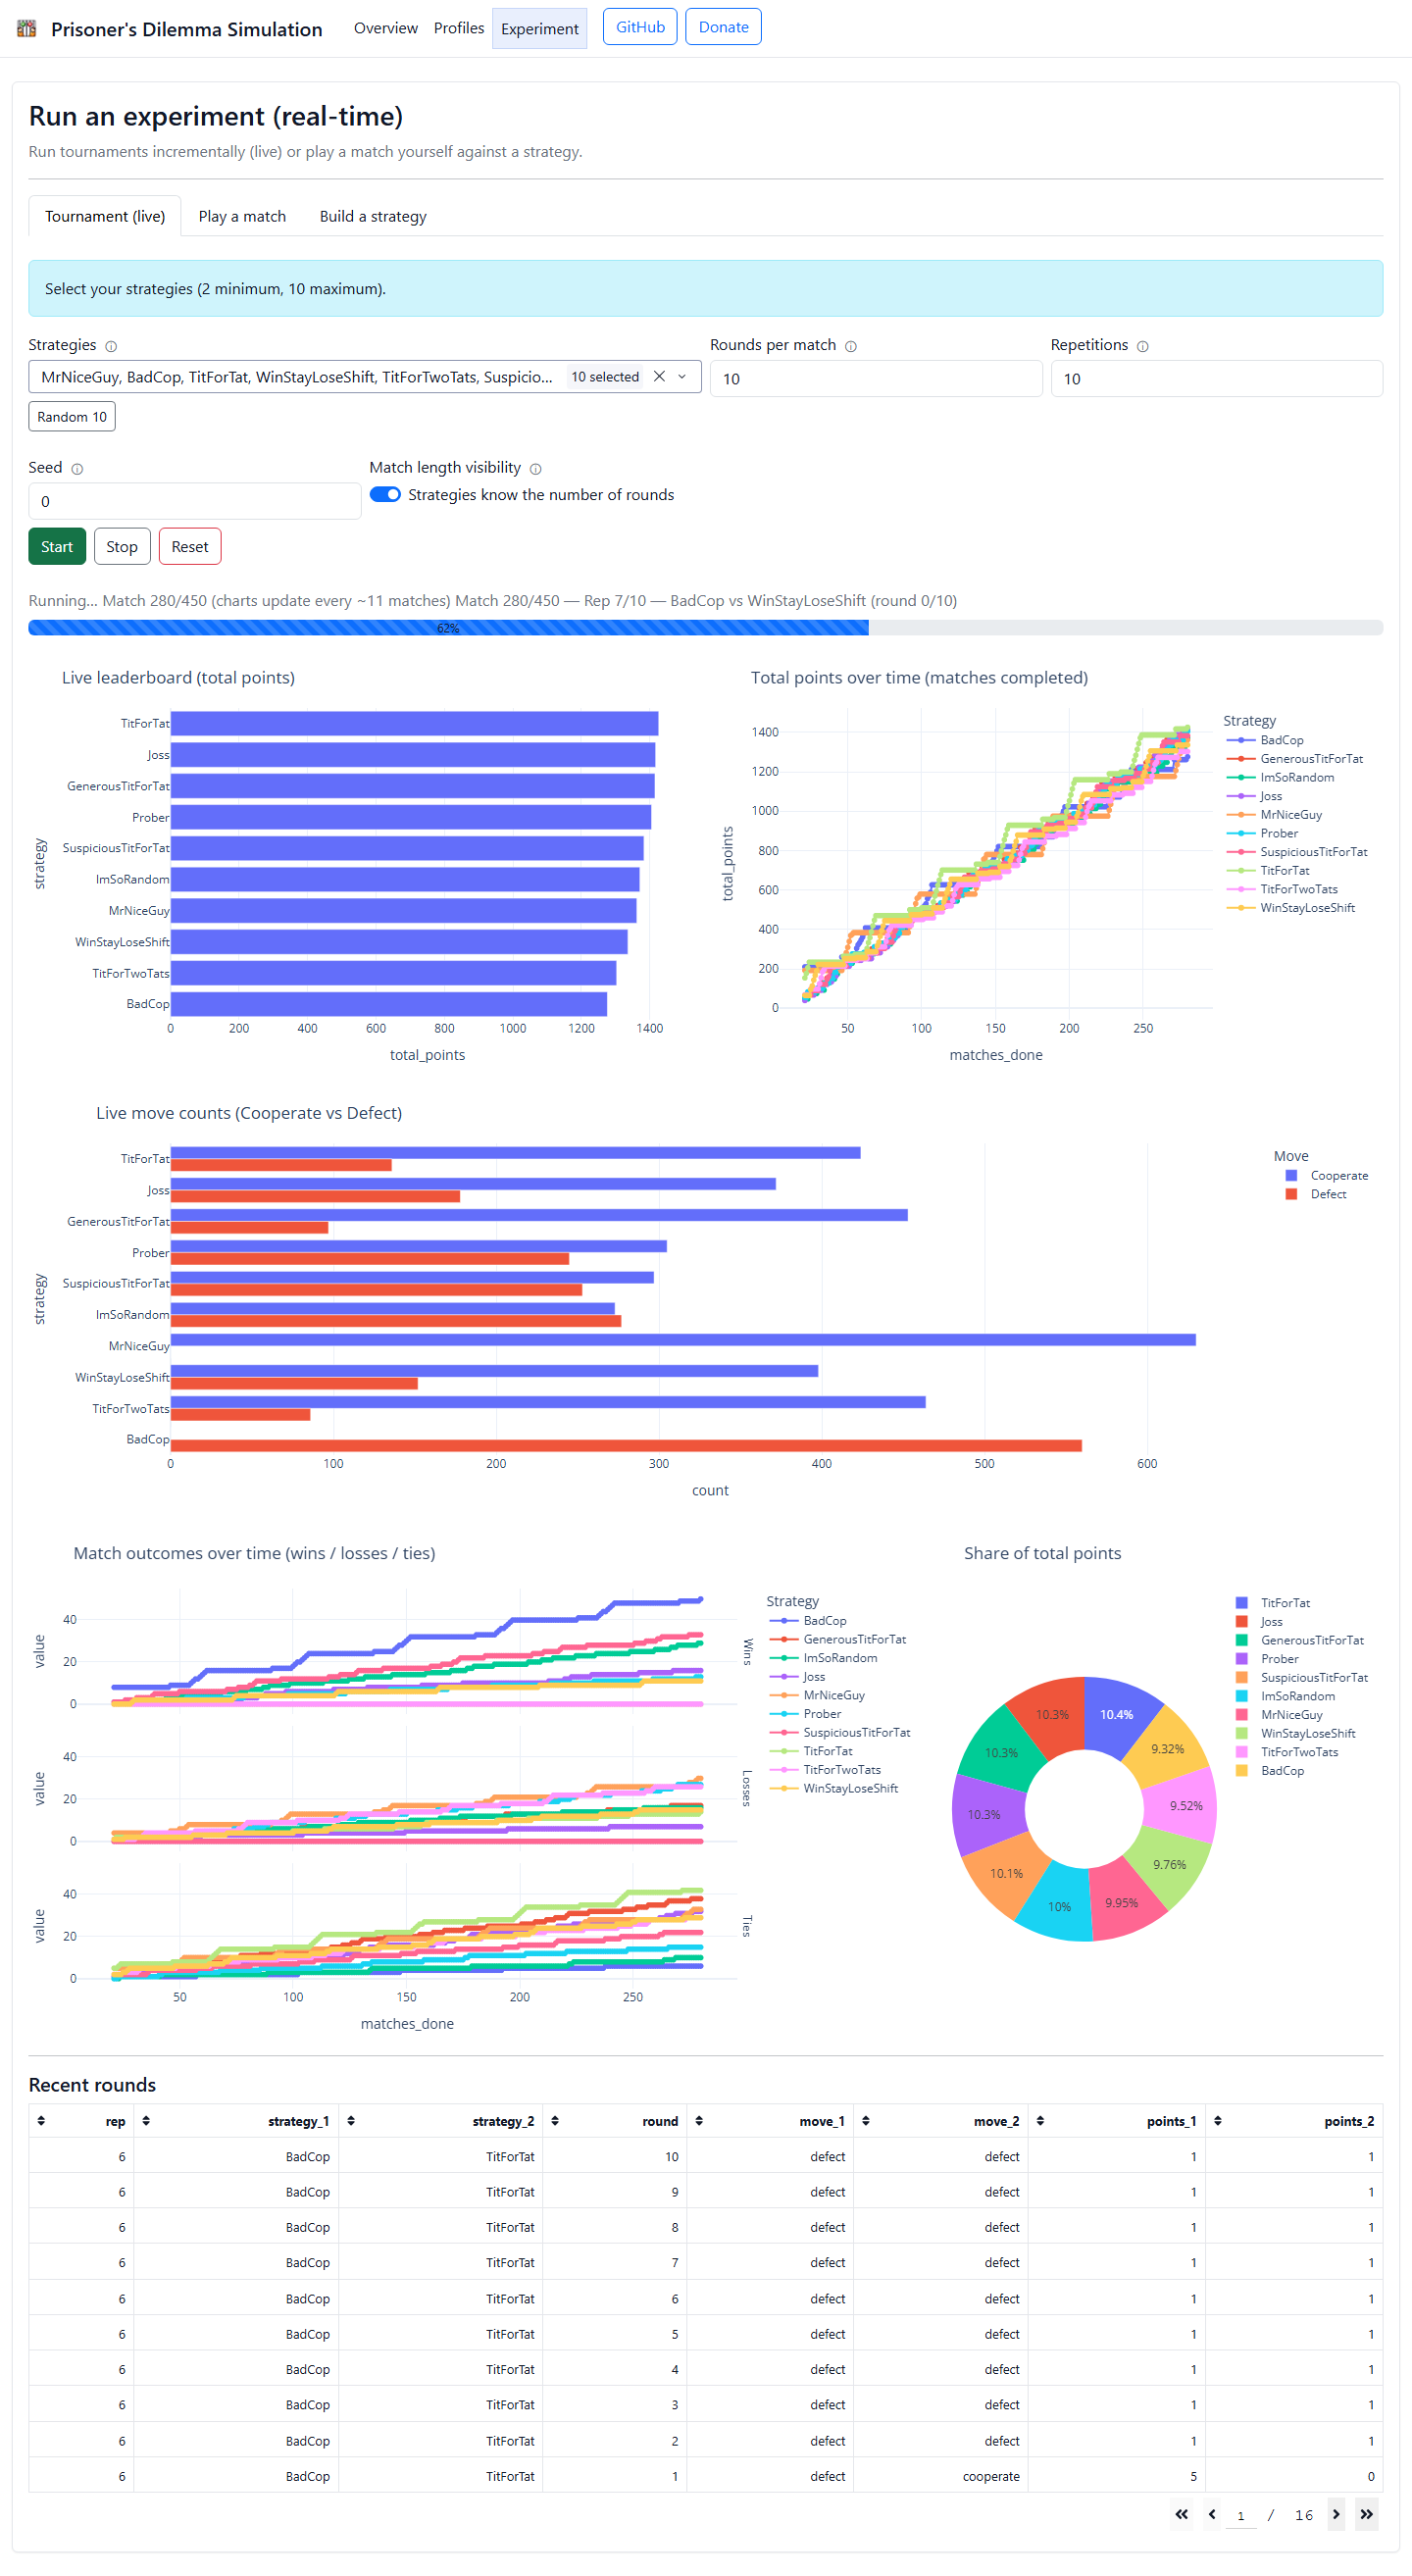
The live runner instead stores a JSON-serializable state object and advances it in bounded chunks. The state tracks the current repetition, pairing, round, histories, aggregate totals, compact recent rows, and sampled timeline snapshots. Dash’s interval callback repeatedly requests the next chunk until the tournament is complete.
Two controls keep the client payload bounded:
- Recent rounds are stored in a compact positional format and capped.
- Timeline snapshots are sampled by stride and capped independently.
This design lets the application update progress bars and charts while controlling callback latency and browser memory use.
Reproducibility
Stochastic strategies are useful only when their behavior can be investigated. The simulation therefore accepts a seed and carries deterministic random state through incremental execution. The same strategy set, seed, horizon setting, round count, and repetition count produce the same run.
Repetitions answer a different question: whether a result remains stable across many pairings within one seeded experiment. Testing multiple seeds then shows whether a strategy’s apparent advantage is robust or dependent on one random sequence.
Product experience
The application supports several ways to interrogate the system:
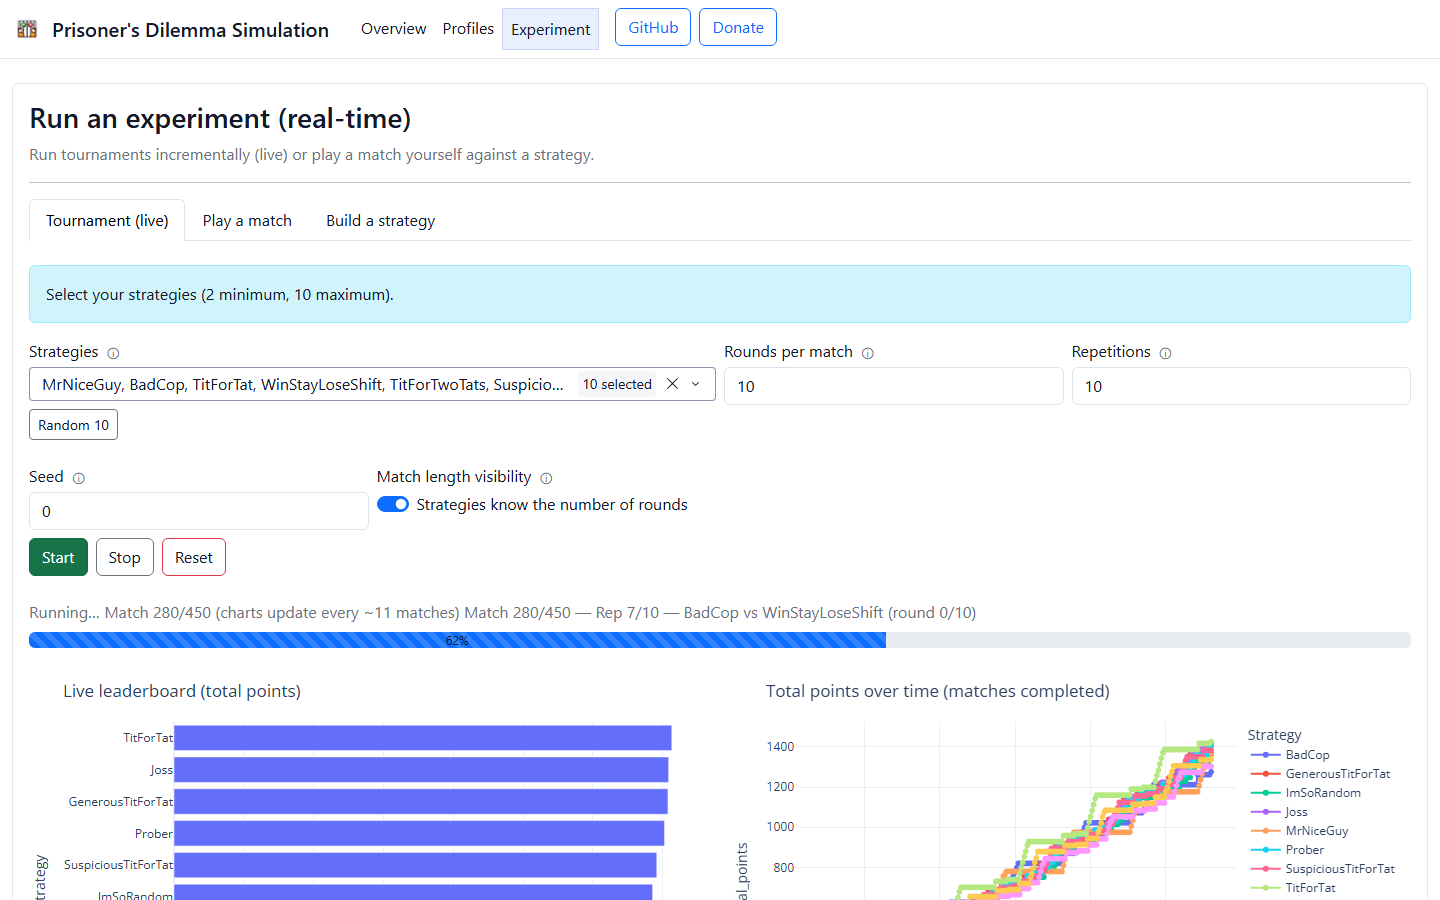
- Live tournament: Select up to 10 strategies and watch rankings, cooperation, and match outcomes update.
- Human match: Play round by round against any built-in strategy.
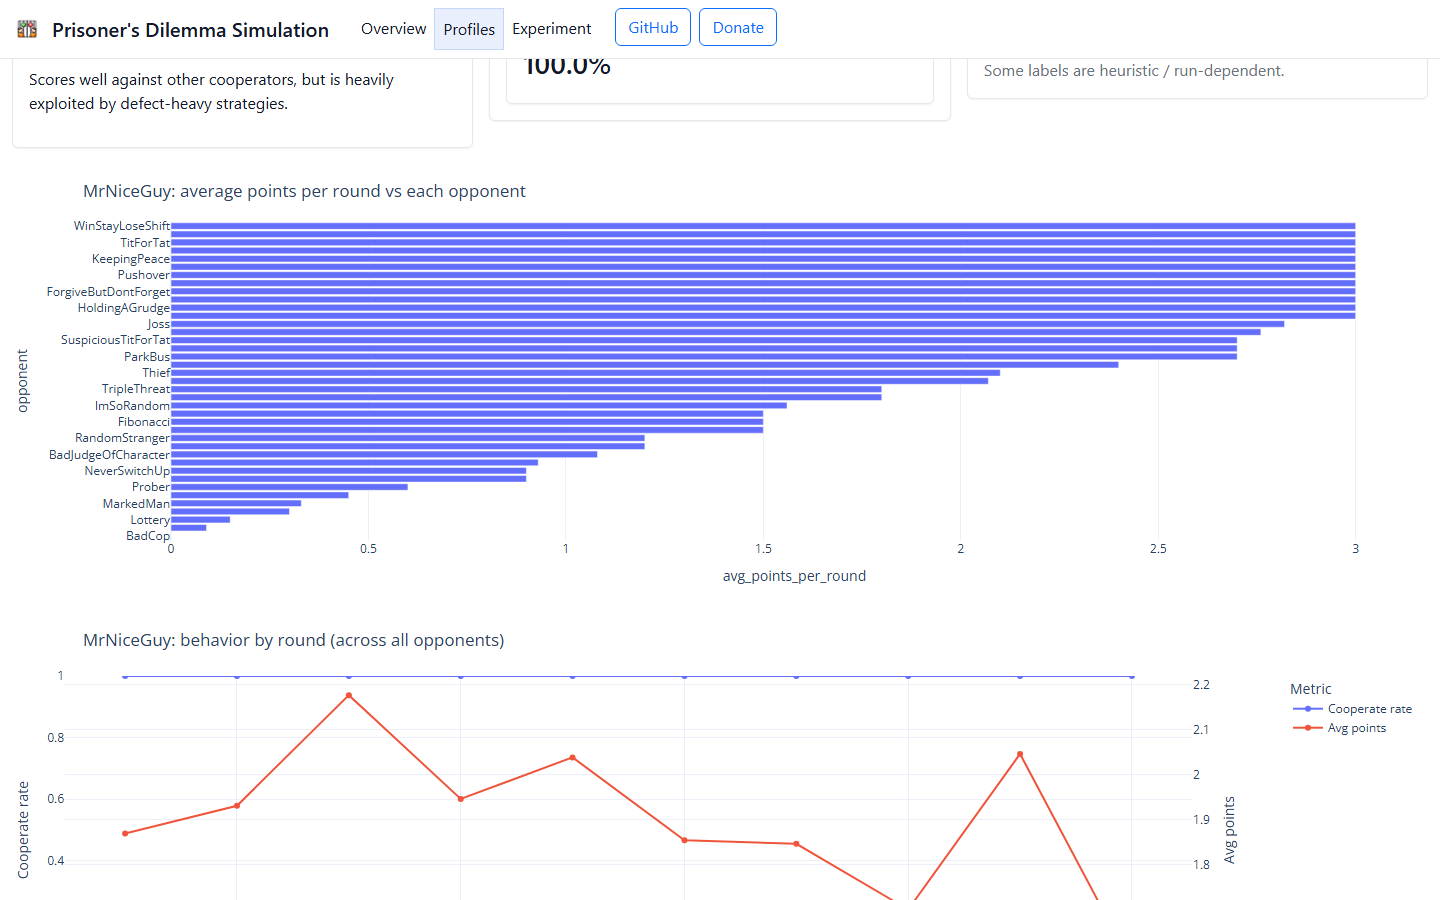
- Strategy profiles: Inspect a strategy’s behavior and performance against every opponent.
- Comparison: Place two strategies side by side and examine head-to-head and population-level results.
- Custom strategy builder: Assemble a safe rule-based strategy without executing arbitrary user code.
- Exports: Download summaries as CSV and figures as PNG or PDF.
Reproducible benchmark
I ran a bounded benchmark against repository commit 569c25965d166874be04178a31b6e47b81a4755a.
Protocol
- 10 representative strategies
- 20 rounds per match
- 30 round-robin repetitions
- Seeds
0through9 - One run per seed with an unknown horizon and one with a known horizon
- 20 complete tournament runs in total
The cohort was MrNiceGuy, BadCop, TitForTat, WinStayLoseShift, GenerousTitForTat, Joss, Prober, ImSoRandom, HoldingAGrudge, and Lottery. The table reports the mean across all 20 runs. Standard deviation measures seed and horizon sensitivity within this bounded cohort.
| Strategy | Avg. points per round | Std. dev. | Cooperation rate |
|---|---|---|---|
| TitForTat | 2.390 | 0.014 | 69.2% |
| GenerousTitForTat | 2.348 | 0.017 | 72.0% |
| Prober | 2.254 | 0.013 | 40.9% |
| HoldingAGrudge | 2.234 | 0.014 | 52.5% |
| Joss | 2.205 | 0.025 | 50.0% |
| WinStayLoseShift | 2.181 | 0.013 | 72.6% |
| BadCop | 2.071 | 0.011 | 0.0% |
| Lottery | 2.051 | 0.017 | 1.2% |
| ImSoRandom | 1.934 | 0.021 | 50.0% |
| MrNiceGuy | 1.840 | 0.008 | 100.0% |
Tit for Tat led this cohort, but aggregate rank does not imply dominance in every pairing. Pairwise runs used the same 20 rounds, 30 repetitions, and seeds 0-9:
| Pairing | Horizon | A points/round | B points/round | Outcome across 300 matches |
|---|---|---|---|---|
| TitForTat vs BadCop | Unknown | 0.950 | 1.200 | BadCop won 300 |
| TitForTat vs MrNiceGuy | Unknown | 3.000 | 3.000 | 300 ties |
| GenerousTitForTat vs Joss | Unknown | 2.507 | 2.766 | Joss won 225; 75 ties |
| Lottery vs TitForTat | Unknown | 1.200 | 0.950 | Lottery won 300 |
| Lottery vs TitForTat | Known | 1.175 | 1.050 | Lottery won 150; 150 ties |
These results demonstrate the central system behavior: performance depends on the opponent population, experiment settings, and information available to each strategy. A strategy can rank well across a cooperative population while losing a specific adversarial matchup.
Limits of the benchmark
This is a reproducibility check and product demonstration, not a universal ranking of Prisoner’s Dilemma strategies. The cohort is intentionally limited to the live application’s 10-strategy maximum, payoff values are fixed, and the experiment does not model mutation, population replacement, communication, or evolutionary selection.
Engineering tradeoffs
Inspectability over maximum throughput
The live mode keeps round history, progress, and visual feedback available rather than optimizing solely for batch speed. For research at a much larger scale, the engine should run as a background job with persisted results instead of passing state through Dash callbacks.
Rule-based customization over arbitrary code
The custom strategy builder limits users to supported rules. This is less expressive than accepting Python, but it avoids executing untrusted code on the server.
Reproducible pseudo-random state
Explicit random state adds implementation complexity, but it keeps incremental and repeated experiments explainable. Reproducibility is more valuable here than cryptographic randomness.
Bounded live experiments
The 10-strategy cap protects responsiveness. The underlying engine can evaluate a larger population, but the public interface prioritizes understandable, interactive runs.
Deployment
The Dash application is served with Gunicorn and configured for Render deployment. Static assets provide the visual layer, while the simulation state remains serializable so callbacks can move between browser requests without relying on hidden process memory.
What I learned
The most important design decision was treating the simulation as an evidence-producing system rather than a collection of animations. Seeds, repetitions, horizon controls, profiles, exports, and pairwise views all exist to help a user explain a result.
The project also reinforced that algorithm quality is contextual. The highest-scoring strategy is a property of the environment and opponent population, not a permanent label attached to one implementation.
References
- Stanford Encyclopedia of Philosophy: Prisoner’s Dilemma
- Axelrod-Python documentation
- Axelrod, R. (1981). The Evolution of Cooperation. Science. DOI
- Nowak, M. A. (2006). Five Rules for the Evolution of Cooperation. Science. DOI
- Press, W. H., & Dyson, F. J. (2012). Iterated Prisoner’s Dilemma contains strategies that dominate any evolutionary opponent. PNAS. DOI