Blog
Change the Rules, Change the Outcome: Exploring Game Theory Atlas
A shortcut can make a journey take longer. A safe individual choice can prevent a better shared outcome. A strategy that beats one rival can lose to another, keeping several competitors in play.
Those are different problems, and they need different models. That is what I wanted to make easier to explore with Game Theory Atlas: move from a question to an experiment, change an assumption, and see what follows.
In my Prisoner’s Dilemma article, I changed the opponent population and watched the rankings change. The Atlas expands that inquiry to other kinds of interaction: coordination, bargaining, congestion, signaling, and competition for shared resources.
Here are five ways into it. The screenshots are captures of the actual interfaces, including populated simulation states. They illustrate particular configurations, rather than a ranking of strategies or a forecast of real behavior.
Stag Hunt: when cooperation needs assurance
In Stag Hunt, hunting a stag offers a better shared payoff, but success requires another hunter to cooperate. Taking a hare provides a safer individual return.
The interesting question is how much confidence you need in other people before the cooperative choice becomes worthwhile.
The Atlas model places hunters on a grid. Their payoffs depend on the strategies around them, and the population changes through local imitation. The resulting patches make something visible that an average cooperation percentage can hide: who your neighbors are matters.
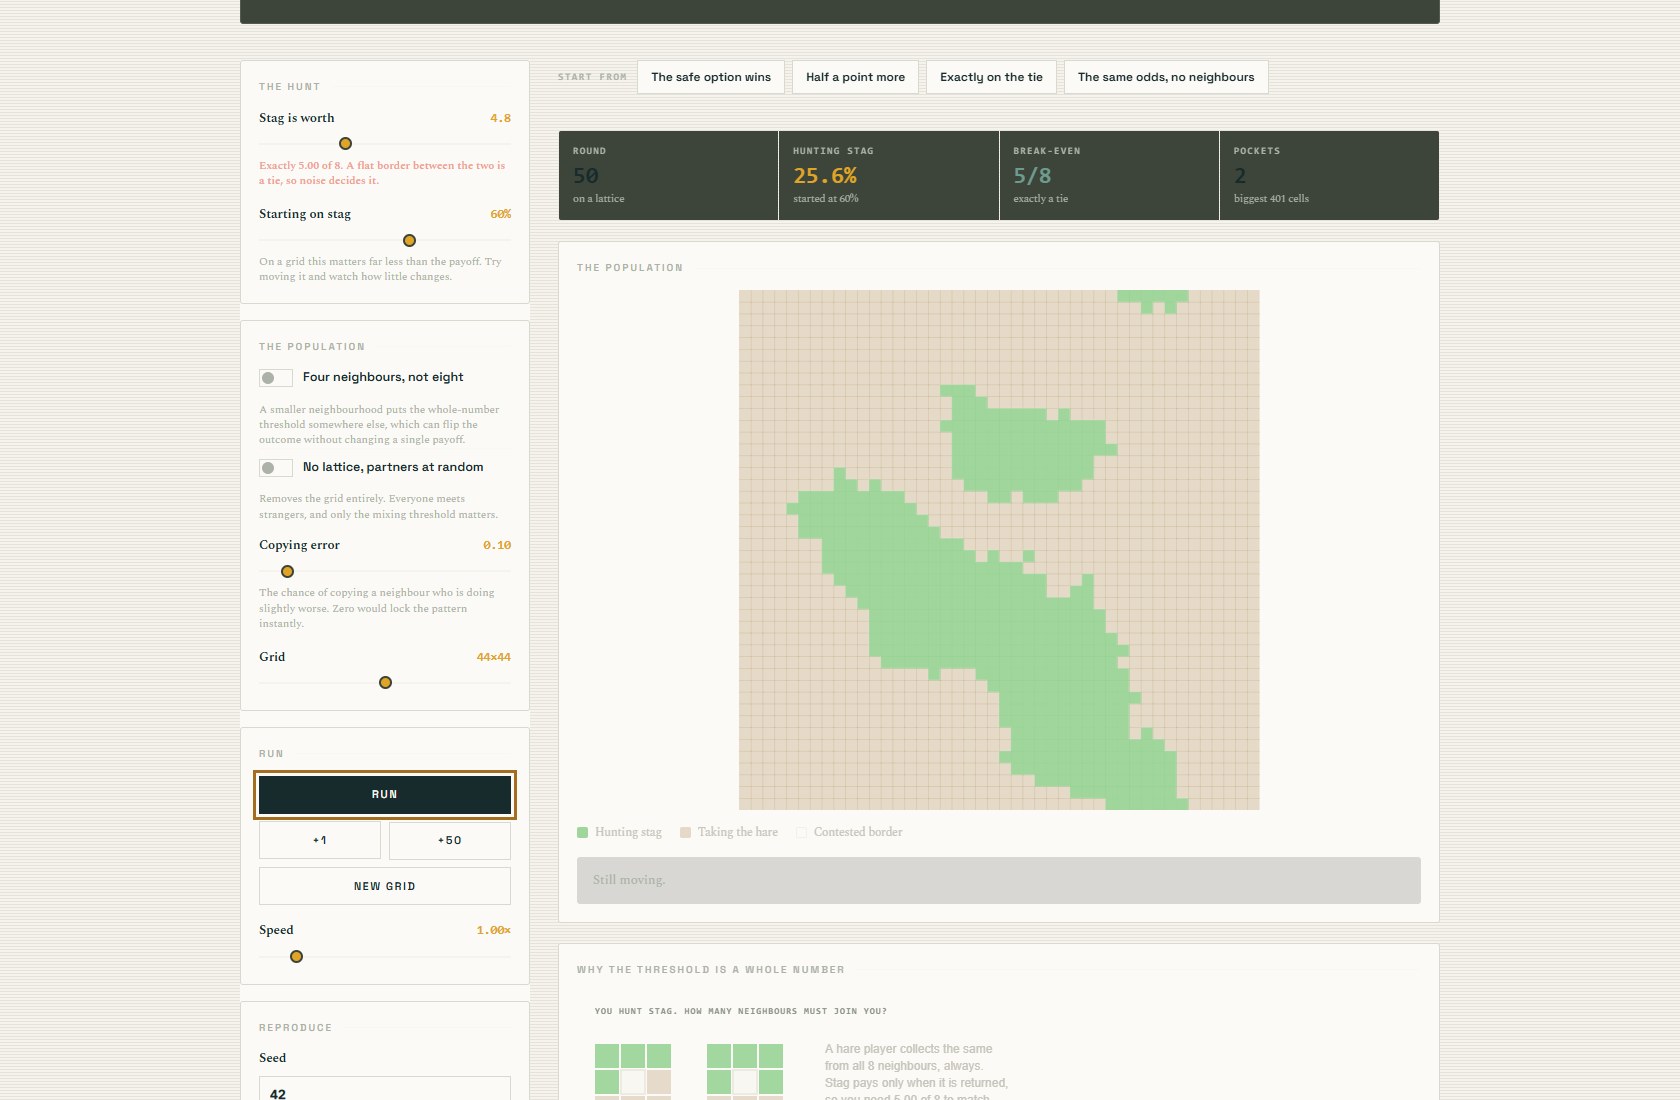
This captured run uses seed 42 and shows the grid after 50 rounds. The patches are model states, not observations of human behavior.
Try this: open Stag Hunt, advance the population, then change the stag payoff. Compare the spatial grid with the option that matches partners at random. Keep the other settings consistent so you can identify what changed.
I find this a useful way to think about coordination: a better collective outcome may be available, while the local conditions still make the safer option attractive.
Trust: the opportunity to choose a partner
In the Trust Game, an investor can send part of an endowment to a trustee. The amount grows in transit. The trustee then chooses how much to return.
Sending creates potential value, but the investor does not control whether any comes back. The model lets populations evolve both their sending and returning behavior, and adds a control for comparing potential partners.
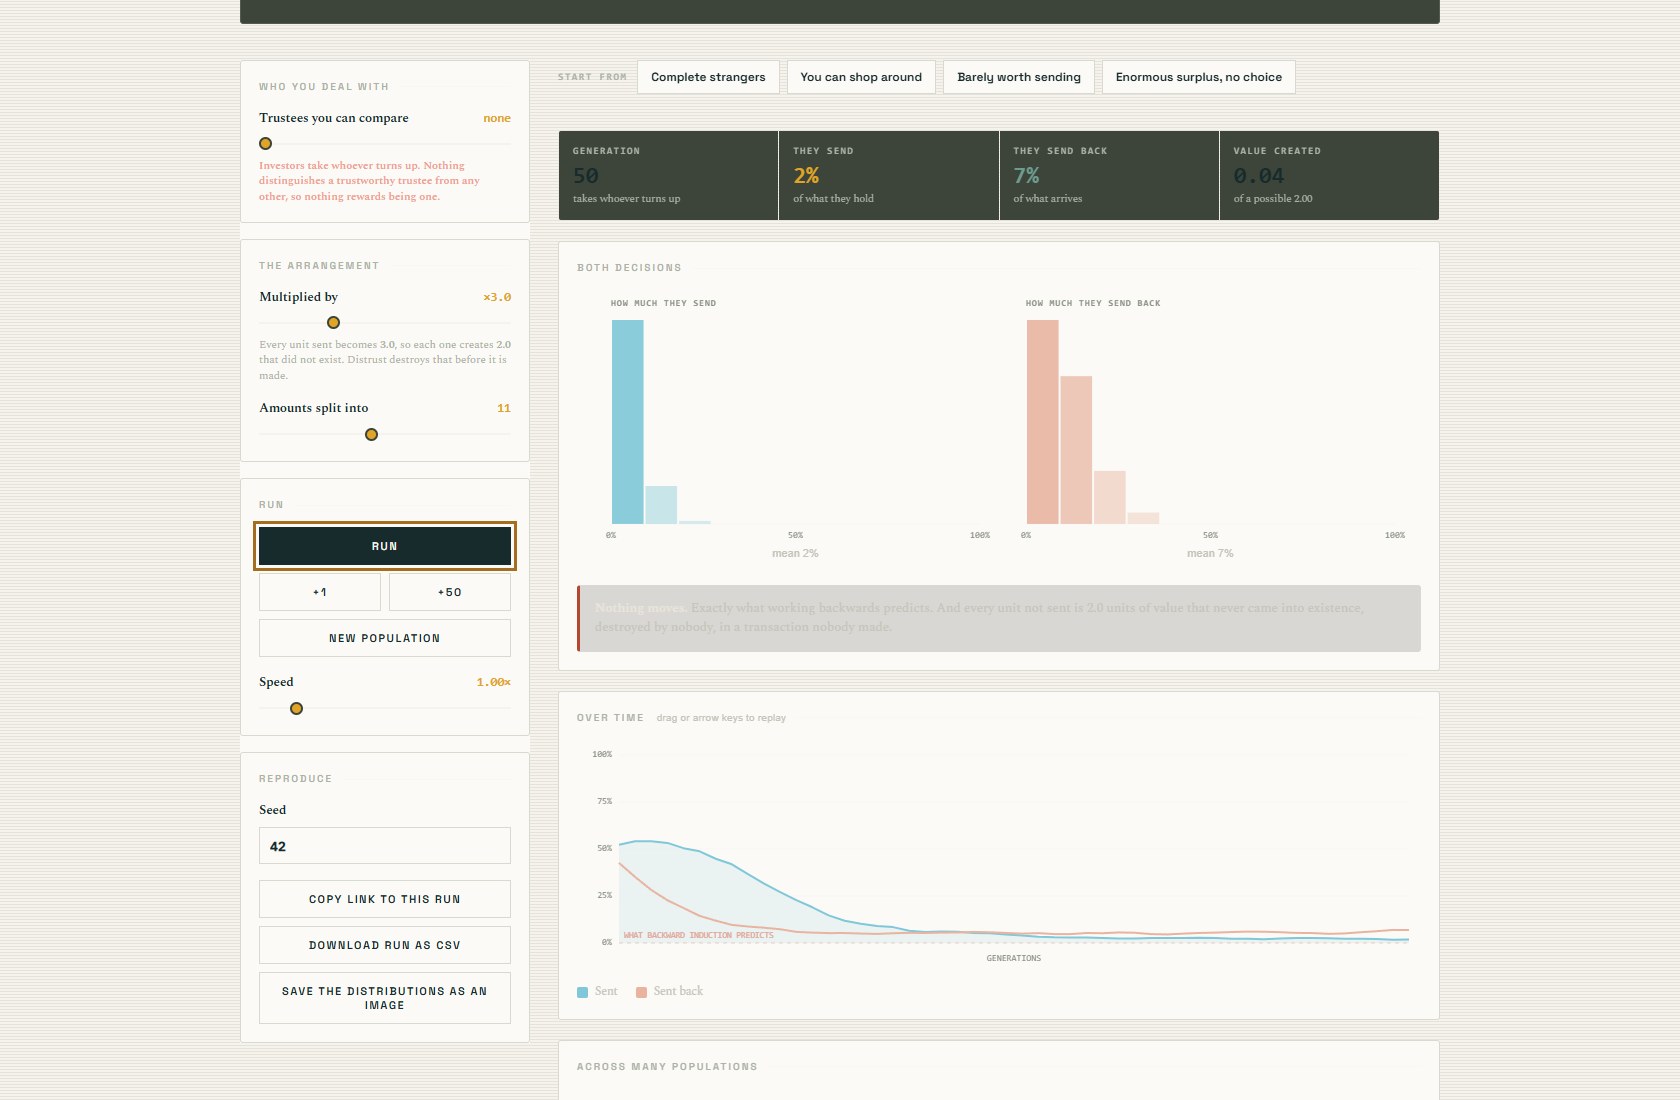
The captured run has advanced 50 generations from seed 42 with no candidate comparison. It is one illustrative trajectory under those settings.
Try this: start with Trust Game. Compare the “Complete strangers” and “You can shop around” presets. Then inspect their parameters, because a preset can change more than one setting. For a controlled comparison, use the same seed and multiplier and change only how many trustees an investor can compare.
The question becomes more specific than whether a population is trusting. What does this environment reward? Can a generous trustee attract future investors? What changes when investors have no way to choose between partners?
Braess’s Paradox: a shortcut changes everyone’s route
Braess’s Paradox is a particularly direct example of the difference between an individual incentive and a system outcome.
Drivers choose routes through a small network. Some links take longer as more drivers use them. Opening an extra connection changes the choices available to everyone, which changes the congestion they create for one another.
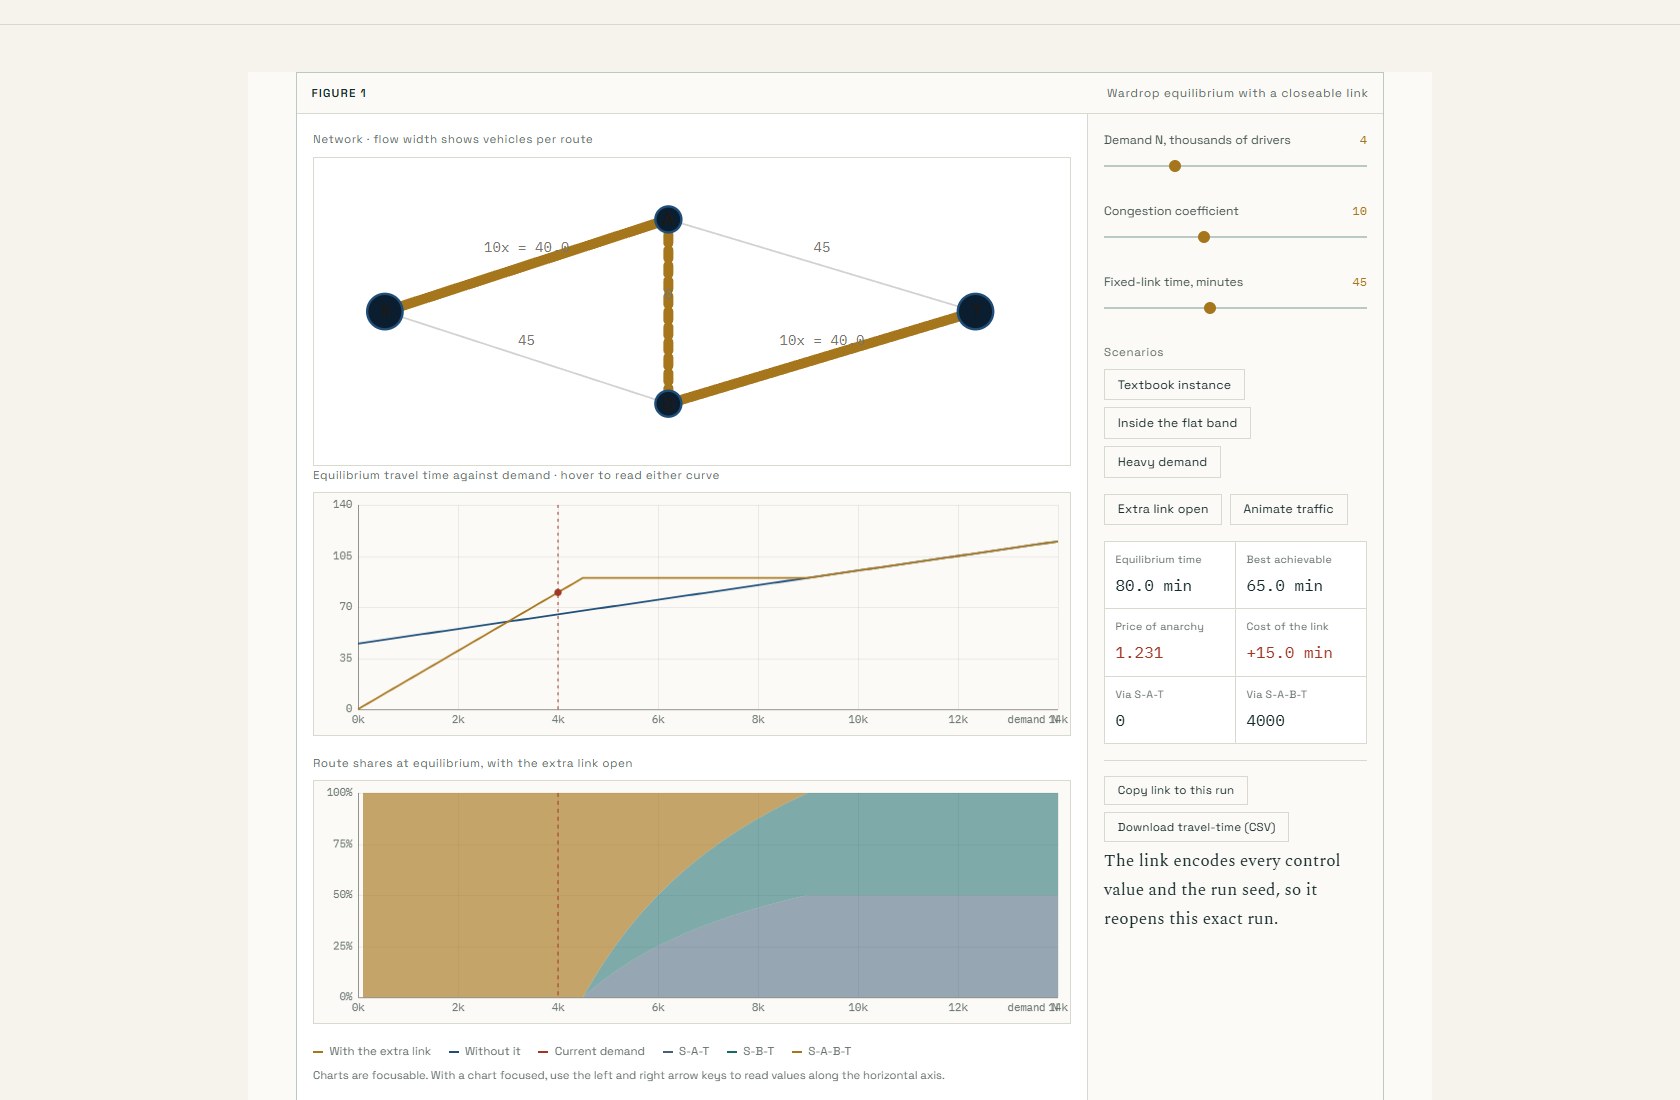
At the captured textbook settings, demand is 4,000 drivers, the congestion coefficient is 10, and the fixed-link time is 45 minutes. The model computes an 80-minute equilibrium with the extra link open; closing it gives 65 minutes.
Those numbers come from this model’s equations and parameters. They are not measurements of a real road network. The interface solves the equilibrium directly, so the moving traffic is a visualization of the computed allocation.
Try this: open Braess’s Paradox, choose “Textbook instance,” and toggle the extra link. Then increase demand and compare the travel-time curves. The shortcut’s effect depends on the demand level.
This is the kind of model I want to keep in mind when adding capacity or giving users more choices. A new option can change behavior across the whole system, and its effect needs to be evaluated in that context.
Cyclic Dominance: competition without a permanent winner
Cyclic Dominance uses a rock-paper-scissors relationship: each type has an advantage over one competitor and a disadvantage against another.
The spatial model makes that relationship visible as populations spread, compete, and leave changing patches on a lattice. Instead of one score deciding everything, the interface exposes population frequencies and the conditions under which competitors persist.
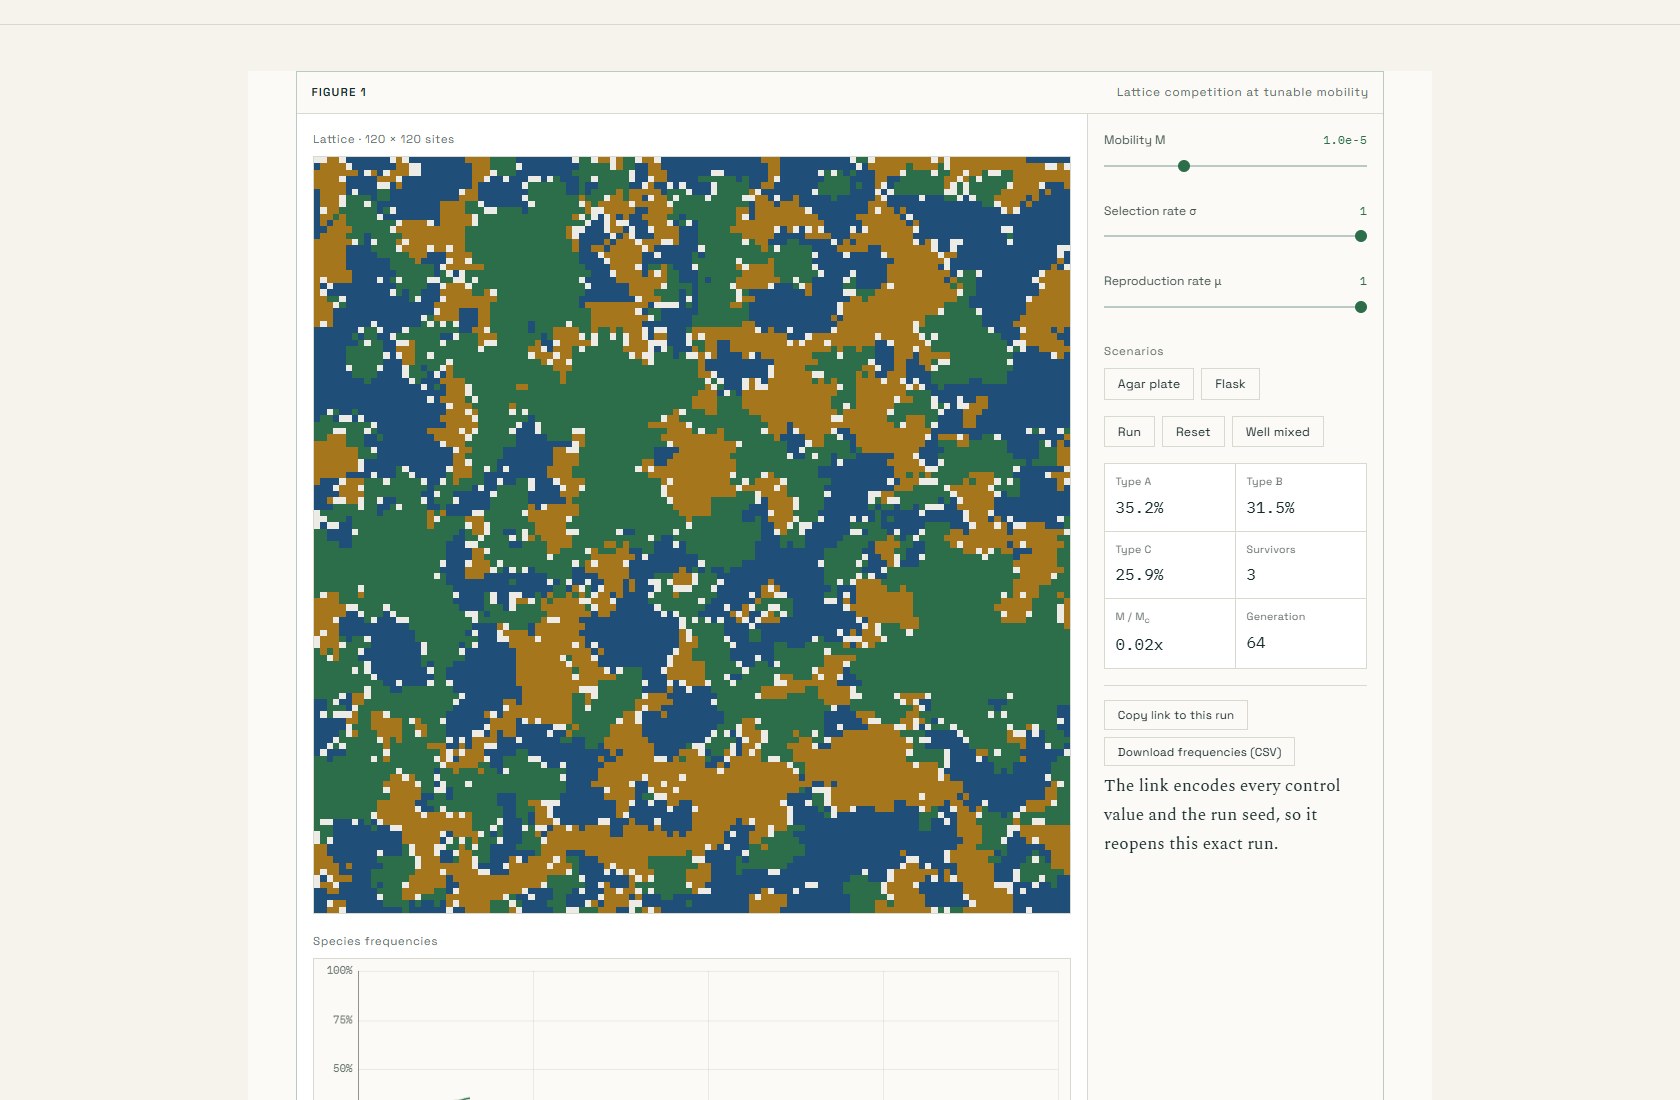
This screenshot captures a running lattice experiment after it has advanced. Its population shares belong to that run and configuration.
Try this: open Cyclic Dominance, run the “Agar plate” setting, and compare it with “Flask.” Inspect the mobility setting and the population-frequency chart alongside the pattern.
The useful question is which interactions allow competitors to coexist, and which changes remove that possibility. The grid and the time series offer different views of the same experiment.
Commons Lab: follow the resource as well as the reward
Commons Lab brings the focus to agents sharing a renewable resource. Each agent requests an allocation, while the resource regenerates according to the experiment’s rules.
The default run I captured ended in collapse at round 6. The interface reports the remaining resource, total harvest, unmet demand, and several measures of the collective outcome.
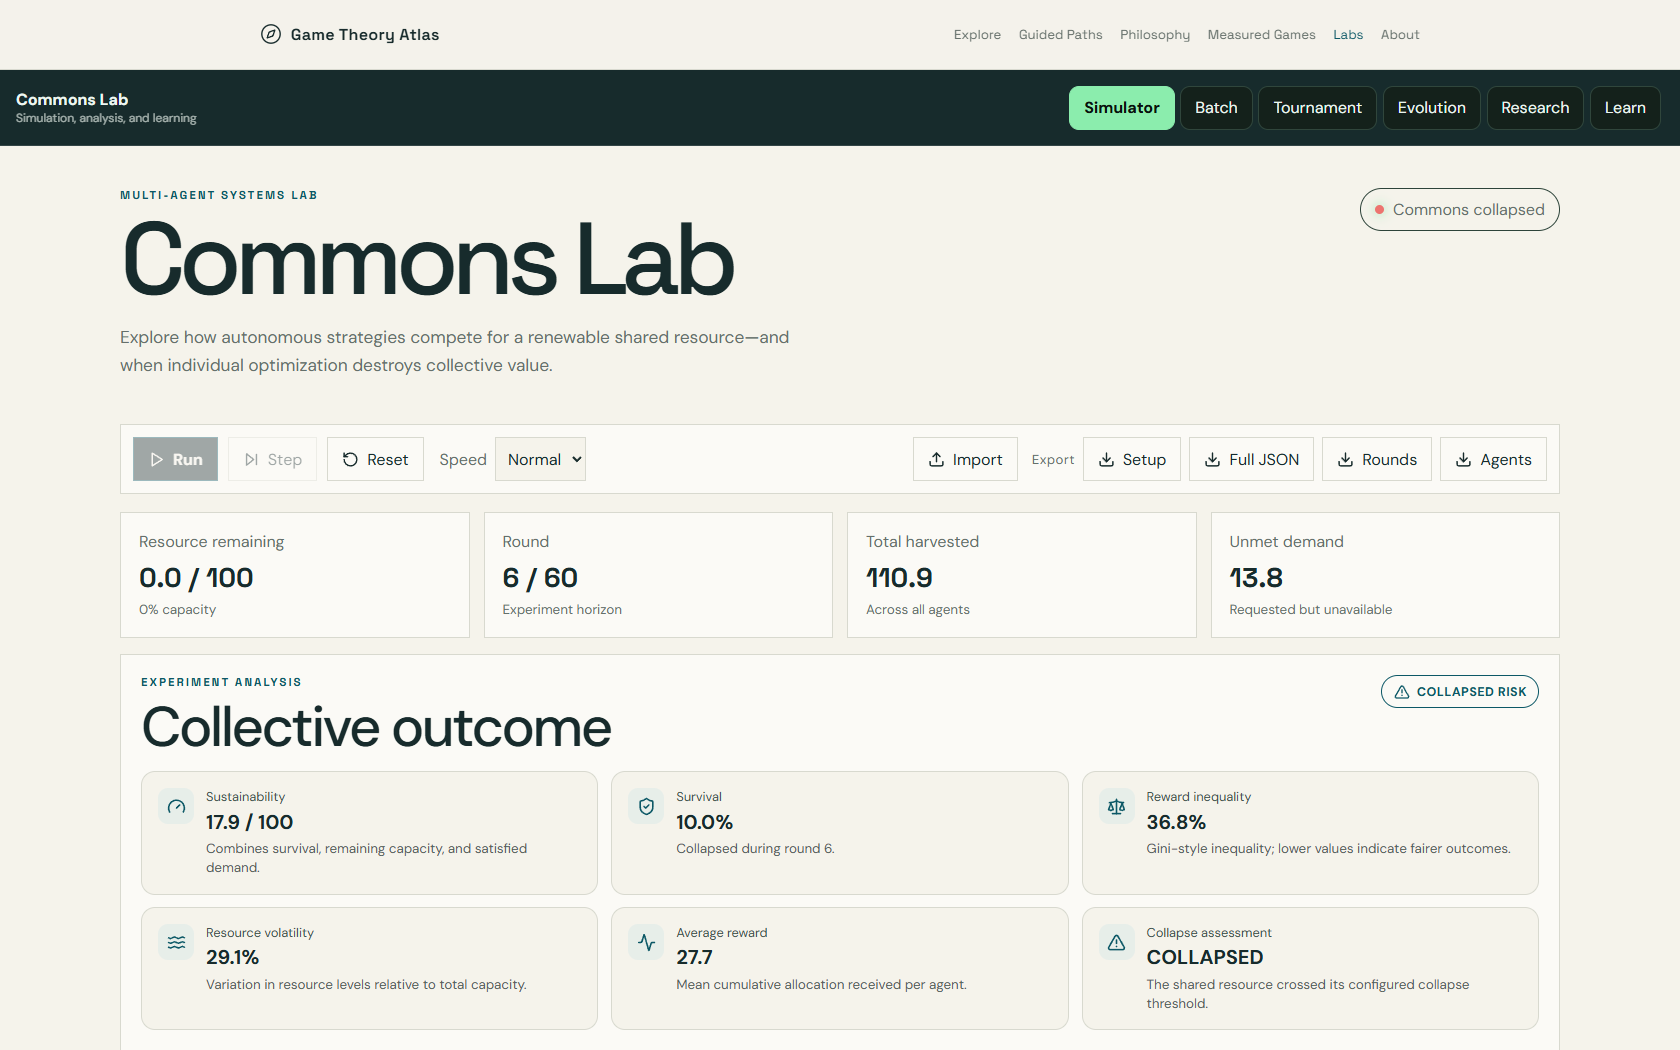
The screenshot shows one default-configuration run. The planned horizon was 60 rounds; the shared resource was depleted at round 6. This is a demonstration state, not an estimate of how real communities manage resources.
Try this: open Commons Lab, run the initial setup, and inspect the resource trace and individual agent behavior. Reset, change one resource or strategy setting, and compare the next run. Batch and tournament views are available when you want to move beyond a single trajectory.
The lesson for evaluating a system is practical: cumulative reward can tell one story while the resource needed to earn future rewards tells another. I want both on the screen.
A way to explore the rest
The project case study now includes a carousel with 41 examples: the Atlas’s 40 game and model pages, plus the full Commons Lab. A picker lets you jump to a particular model, and each slide links to its interactive experience. The Explore catalog and Guided Paths provide other ways to find related questions.
For any of these experiments, my starting routine is the same:
- Identify the choices, payoffs, and information each participant has.
- Run a baseline and record its settings.
- Change one assumption, keeping the comparison as consistent as the model allows.
- Inspect the individual behavior, population pattern, and time series together.
- Repeat stochastic experiments before drawing conclusions from a striking run.
A model earns its place by making an assumption inspectable. I want the Atlas to help someone ask a sharper question after an experiment: what produced that outcome, what would change it, and which parts of the situation have we left out?