Blog
Using Simulation to Compare Decisions Before Choosing a Strategy
In one run of my Prisoner’s Dilemma simulator, the strategy that always defects finished first. In the next run, it finished last.
I kept the payoff rules, match length, repetitions, and execution settings the same. I changed the other strategies in the tournament.
That is the part of simulation I find most useful. A result comes with assumptions. Changing those assumptions helps reveal what a strategy depends on, where it succeeds, and why a promising score might disappear in a different environment.
For this article, I ran two small tournaments and a comparison across ten random seeds on prisonersdilemma.dev, then expanded the experiment to all 60 built-in strategies. The screenshots, video, and larger comparison figure come from those runs. The experiment files are linked below so you can inspect the settings or try them yourself.
Start with a model you can explain
The Prisoner’s Dilemma gives each player two choices: cooperate or defect. Both choose before seeing the other player’s current move. My simulator uses this payoff matrix:
| Your move | Opponent’s move | Your points | Opponent’s points |
|---|---|---|---|
| Cooperate | Cooperate | 3 | 3 |
| Cooperate | Defect | 0 | 5 |
| Defect | Cooperate | 5 | 0 |
| Defect | Defect | 1 | 1 |
In a single round, defection earns more points regardless of the opponent’s choice. Mutual cooperation, however, earns both players more than mutual defection does.
Repeated play introduces a history. A strategy can react to earlier moves, retaliate after a defection, or attempt to restore cooperation. The simulation engine implements those rules explicitly, making the consequences inspectable one round at a time.
I started with three policies that are easy to follow:
- MrNiceGuy: always cooperate.
- BadCop: always defect.
- TitForTat: cooperate first, then copy the opponent’s previous move.
These simple policies make it possible to explain a ranking from the interactions that produced it.
The first tournament rewards exploitation
I selected those three strategies and used 20 rounds per match, 10 repetitions, and seed 0. Self-play and execution errors were off, and strategies were not told the match length. Every distinct pair played ten matches, giving 30 matches in total.
All three policies are deterministic under these settings. The repetitions repeat the same outcomes; they do not add evidence about randomness. I kept that setting consistent for the next tournament.
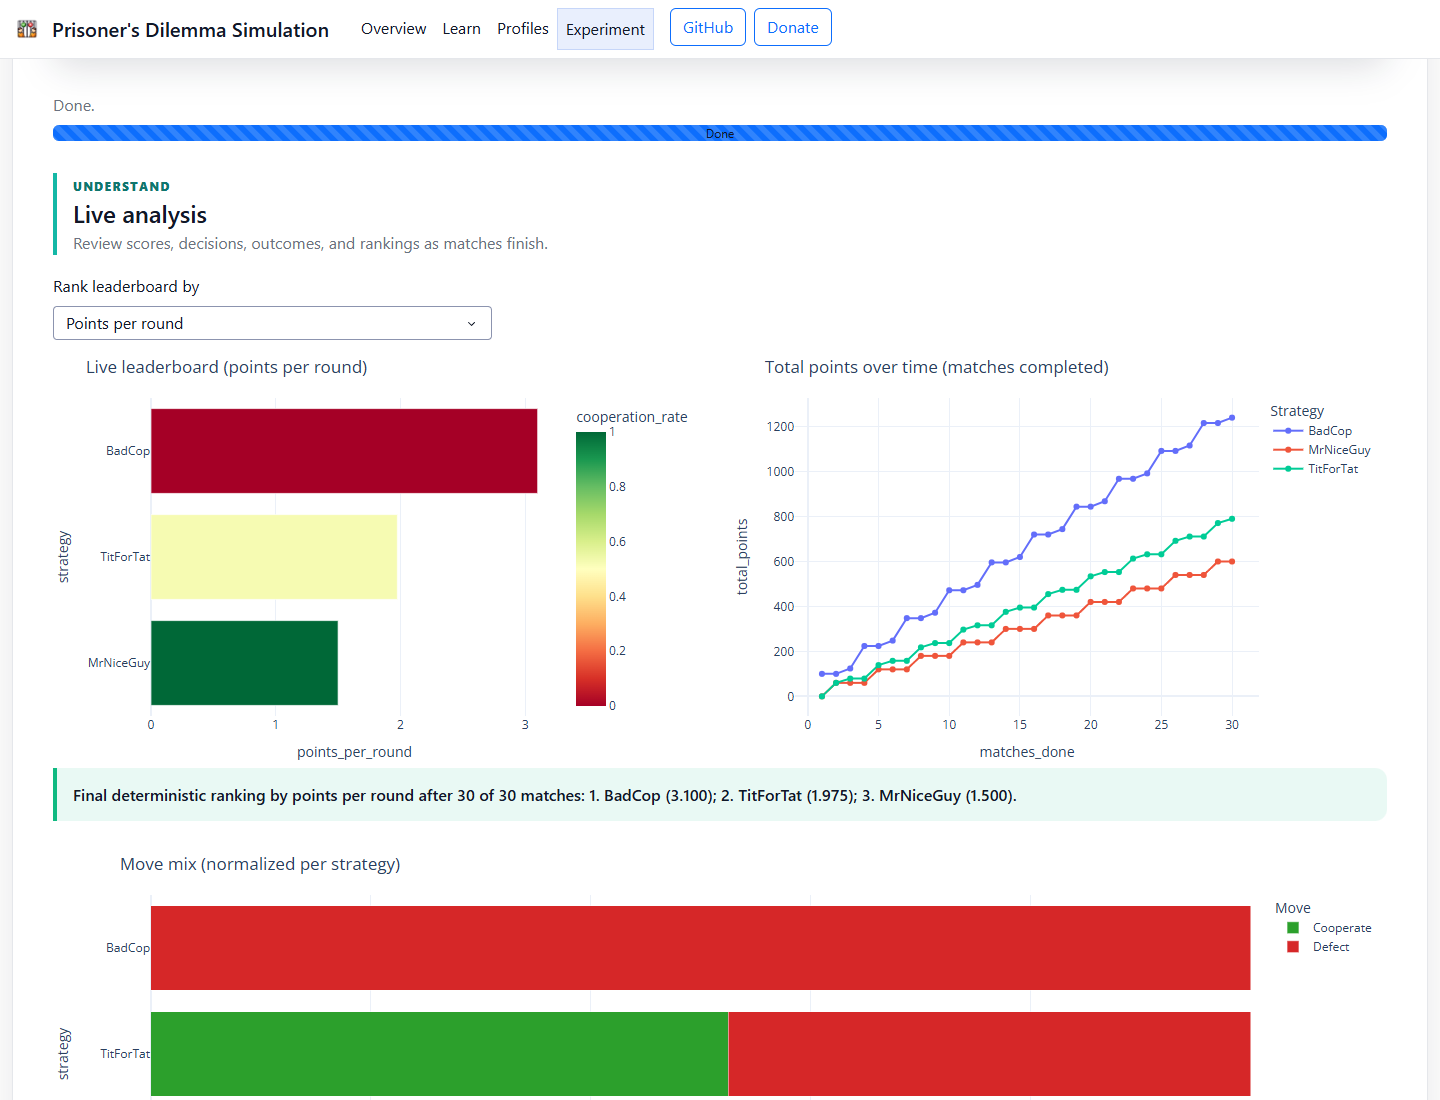
The baseline field contains one unconditional cooperator, one unconditional defector, and one reciprocal strategy. Scores are points per round played by each strategy.
BadCop finished first with 3.100 points per round. TitForTat earned 1.975, and MrNiceGuy earned 1.500.
The individual matchups explain the result. Against MrNiceGuy, BadCop receives 5 points every round, for 100 points in a 20-round match. MrNiceGuy receives zero. Against TitForTat, BadCop earns 5 points in the opening round, followed by 19 rounds of mutual defection worth 1 point each. That gives BadCop 24 points and TitForTat 19.
TitForTat and MrNiceGuy cooperate throughout their match, earning 60 points each. Even so, BadCop’s exploitation of MrNiceGuy is enough to put it at the top of this field.
That result is quite specific: always defecting maximized average points against these two opponents under these settings.
Change the field and the ranking changes
For the second tournament, I added WinStayLoseShift, TitForTwoTats, and HoldingAGrudge. These introduce different responses to previous outcomes and opponent defections. HoldingAGrudge, for example, cooperates until an opponent defects, then defects for the rest of that match.
I changed only the selected field. The six strategies produced 15 distinct pairings, repeated ten times for 150 matches.
| Strategy | Three-strategy field: points per round | Six-strategy field: points per round |
|---|---|---|
| BadCop | 3.100 | 2.360 |
| TitForTat | 1.975 | 2.590 |
| MrNiceGuy | 1.500 | 2.400 |
| HoldingAGrudge | Not included | 2.590 |
| TitForTwoTats | Not included | 2.580 |
| WinStayLoseShift | Not included | 2.500 |
BadCop moved to last place. TitForTat and HoldingAGrudge tied for first.
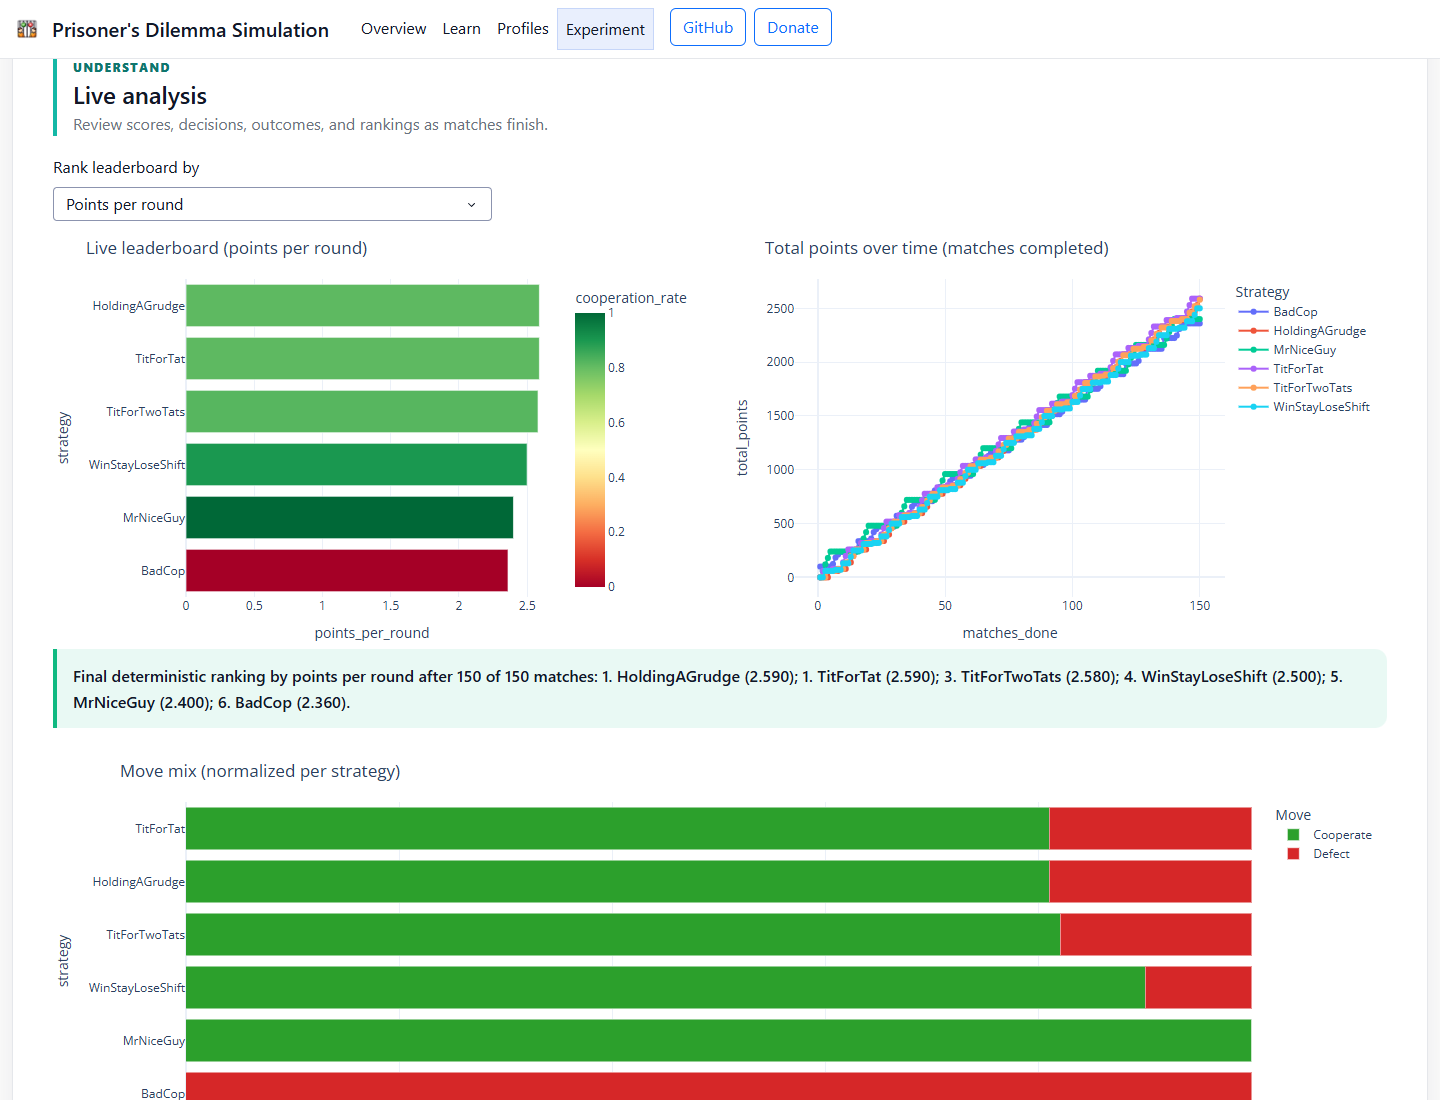
The added strategies change the interactions being averaged. Both tournaments exclude self-play and execution errors and use 20 rounds, 10 repetitions, seed 0, and an undisclosed match length.
The original three pairings still behave exactly as before. Each strategy now also faces three new opponents. BadCop has more opponents that limit exploitation, while cooperative policies have more opportunities to earn the mutual-cooperation payoff.
Using points per round keeps the units comparable as participation increases. The averages still describe different opponent fields. The ranking reversal shows why the choice of opponents belongs in the experiment’s definition.
For a practical evaluation, I would choose that field to represent the conditions I care about, then deliberately include some difficult alternatives. A field chosen only because it makes my preferred policy look good tells me very little about how dependable that policy is.
Look at the behavior behind the score
A leaderboard compresses many interactions into one number. Reading the underlying decisions helps explain that number.
BadCop earns more than TitForTat in their direct match, yet both spend almost the entire match receiving the low mutual-defection payoff. TitForTat and MrNiceGuy tie their direct match while both earn substantially more.
That distinction matters when choosing an objective. Winning a match, maximizing your own accumulated points, increasing combined payoff, and maintaining cooperation ask different questions. They can favor different policies.
The app’s Profiles page provides pairwise comparisons and matchup replay for investigating those details. I use that view to ask when cooperation breaks down, how long punishment lasts, and whether either policy returns to cooperation. A ranking becomes easier to interpret when I can trace it back to a sequence of decisions.
Add randomness, then examine the spread
The first two tournaments isolate the effect of opponent selection. To examine randomness, I ran a separate experiment in the Robustness tab:
- Strategies, in selection order: TitForTat, GenerousTitForTat, BadCop, and ImSoRandom.
- Seeds 0 through 9, with 50 rounds per match and 3 repetitions per seed.
- Match length undisclosed, self-play off, and execution errors set to zero.
GenerousTitForTat and ImSoRandom introduce policy randomness. Each seed runs a complete tournament, producing a distribution of results for the same configured field.
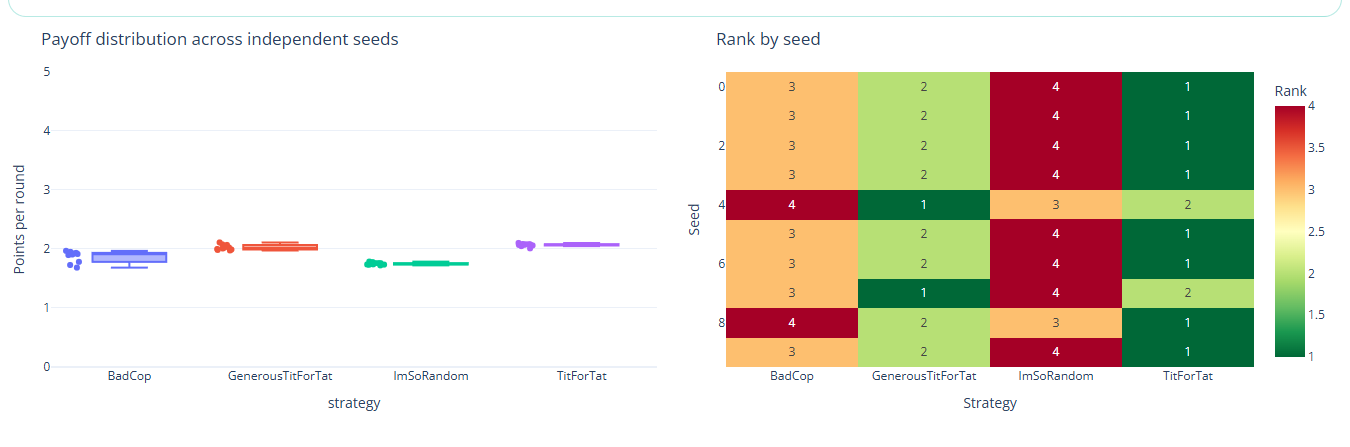
A separate four-strategy seed sweep shows both payoff spread and changes in rank. It uses a different field and match configuration from the two live tournaments above.
| Strategy | Mean points per round | Lowest observed | Highest observed | First-place finishes |
|---|---|---|---|---|
| TitForTat | 2.068 | 2.011 | 2.102 | 8 of 10 |
| GenerousTitForTat | 2.027 | 1.976 | 2.111 | 2 of 10 |
| BadCop | 1.869 | 1.684 | 1.969 | 0 of 10 |
| ImSoRandom | 1.751 | 1.722 | 1.787 | 0 of 10 |
TitForTat had the highest average score, but GenerousTitForTat finished first on two seeds. ImSoRandom had the smallest payoff variation while also having the lowest mean payoff. Consistency and performance need to be considered together.
These are descriptive results for ten configured seeds. The observed ranges are not confidence intervals, and the table does not establish a universal strategy ranking. The exported result includes the individual seed records as well as the summary calculations.
Run all 60 strategies in one field
The smaller fields make individual interactions easy to follow. I also wanted to see what happens when the simulator’s entire built-in catalog competes in the same experiment.
I selected all 60 strategies in the live app’s Robustness tab and ran seeds 0 through 9 with 100 rounds per match and one repetition per seed. Match length remained undisclosed, self-play was off, and execution errors were zero. Each policy faced the other 59 policies. The captured experiment setup shows those controls in the live app.
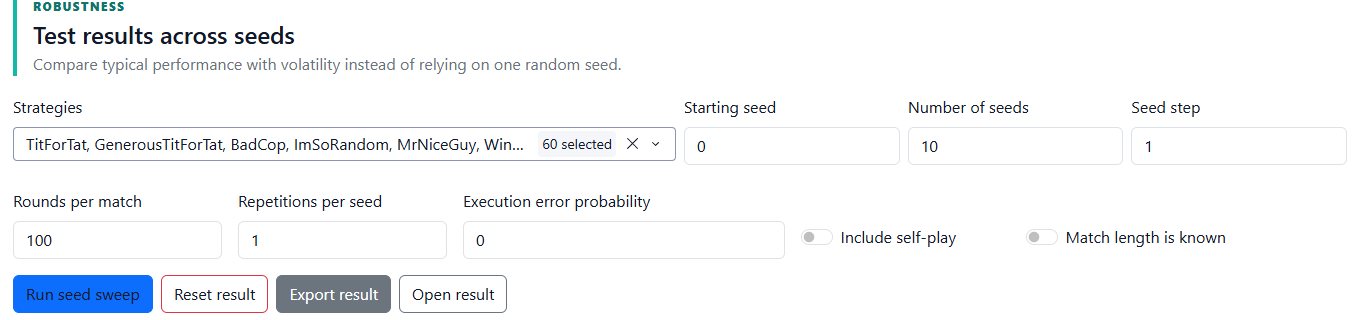
That creates 1,770 distinct pairings per seed. Across the ten seeds, the experiment covers 17,700 matches and 1.77 million rounds. Every strategy participates in 5,900 rounds per seed, giving each the same amount of play to average.
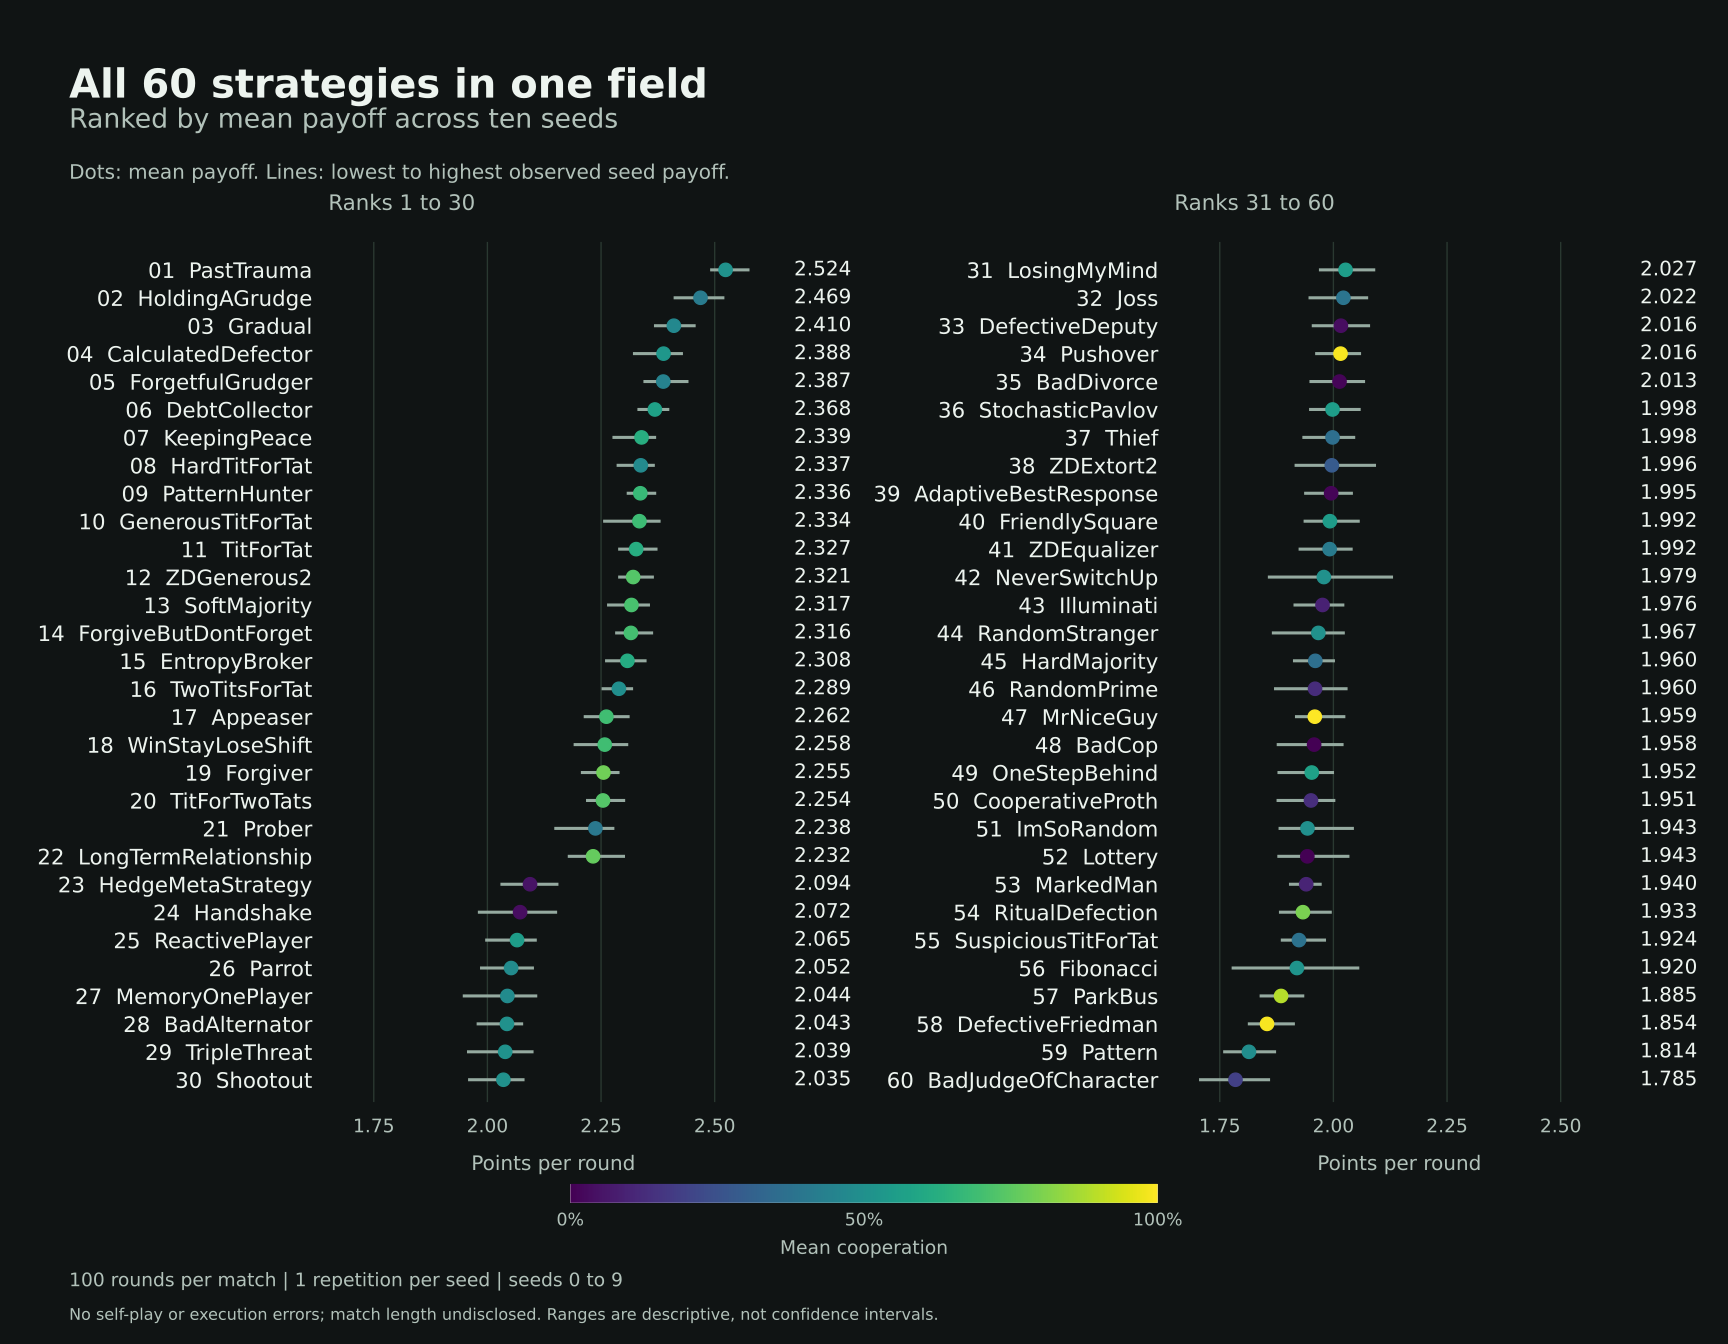
PastTrauma led with 2.524 points per round, finishing first on nine seeds. HoldingAGrudge finished first on the remaining seed and placed second by overall mean payoff at 2.469. Gradual followed at 2.410.
Our original three policies landed in very different positions: TitForTat ranked 11th, MrNiceGuy 47th, and BadCop 48th by mean payoff across seeds. Those positions describe the ordering of the ten-seed averages; a policy’s rank can still change within an individual seed.
NeverSwitchUp illustrates how much that can matter. Its individual-seed rank ranged from 23rd to 58th, despite appearing in the same field under the same rules every time. Its overall average alone would hide that variation.
The broader experiment includes fixed policies, reciprocal responses, scheduled behavior, and adaptive heuristics. Their state resets for each match, so adaptive policies do not carry learning from one opponent into the next. Several policies are related variants; treating each as a separate opponent gives those families more weight in the field.
The field, match length, and repetitions differ from the earlier examples, so differences in ranking reflect those combined settings. The larger comparison gives me more behaviors to investigate, while its conclusions remain specific to this selected catalog and experiment. The ranges describe these ten seeds and do not establish statistical significance or a universal winner.
Explore the complete results for all 60 strategies
Ranks below use the full-precision mean points per round. Displayed values are rounded to three decimals; equal-looking rounded scores can still have different ranks. The seed rank range shows the best and worst placement within an individual tournament.
| Rank | Strategy | Mean points/round | Lowest | Highest | Seed rank range |
|---|---|---|---|---|---|
| 1 | PastTrauma | 2.524 | 2.490 | 2.577 | 1 to 2 |
| 2 | HoldingAGrudge | 2.469 | 2.410 | 2.521 | 1 to 4 |
| 3 | Gradual | 2.410 | 2.366 | 2.458 | 2 to 6 |
| 4 | CalculatedDefector | 2.388 | 2.320 | 2.430 | 3 to 12 |
| 5 | ForgetfulGrudger | 2.387 | 2.343 | 2.442 | 3 to 8 |
| 6 | DebtCollector | 2.368 | 2.330 | 2.400 | 4 to 11 |
| 7 | KeepingPeace | 2.339 | 2.275 | 2.371 | 5 to 18 |
| 8 | HardTitForTat | 2.337 | 2.284 | 2.368 | 7 to 18 |
| 9 | PatternHunter | 2.336 | 2.306 | 2.371 | 6 to 13 |
| 10 | GenerousTitForTat | 2.334 | 2.255 | 2.381 | 4 to 18 |
| 11 | TitForTat | 2.327 | 2.288 | 2.374 | 5 to 16 |
| 12 | ZDGenerous2 | 2.321 | 2.288 | 2.366 | 7 to 16 |
| 13 | SoftMajority | 2.317 | 2.263 | 2.358 | 7 to 17 |
| 14 | ForgiveButDontForget | 2.316 | 2.281 | 2.365 | 6 to 17 |
| 15 | EntropyBroker | 2.308 | 2.259 | 2.350 | 9 to 19 |
| 16 | TwoTitsForTat | 2.289 | 2.251 | 2.321 | 13 to 19 |
| 17 | Appeaser | 2.262 | 2.212 | 2.313 | 13 to 22 |
| 18 | WinStayLoseShift | 2.258 | 2.190 | 2.310 | 13 to 22 |
| 19 | Forgiver | 2.255 | 2.206 | 2.291 | 15 to 21 |
| 20 | TitForTwoTats | 2.254 | 2.217 | 2.303 | 15 to 22 |
| 21 | Prober | 2.238 | 2.147 | 2.279 | 17 to 22 |
| 22 | LongTermRelationship | 2.232 | 2.177 | 2.303 | 12 to 22 |
| 23 | HedgeMetaStrategy | 2.094 | 2.029 | 2.156 | 23 to 34 |
| 24 | Handshake | 2.072 | 1.979 | 2.153 | 23 to 40 |
| 25 | ReactivePlayer | 2.065 | 1.995 | 2.109 | 23 to 38 |
| 26 | Parrot | 2.052 | 1.984 | 2.102 | 24 to 42 |
| 27 | MemoryOnePlayer | 2.044 | 1.946 | 2.110 | 24 to 50 |
| 28 | BadAlternator | 2.043 | 1.976 | 2.079 | 24 to 47 |
| 29 | TripleThreat | 2.039 | 1.955 | 2.102 | 24 to 45 |
| 30 | Shootout | 2.035 | 1.957 | 2.082 | 24 to 47 |
| 31 | LosingMyMind | 2.027 | 1.968 | 2.092 | 24 to 41 |
| 32 | Joss | 2.022 | 1.945 | 2.076 | 25 to 50 |
| 33 | DefectiveDeputy | 2.016 | 1.952 | 2.081 | 25 to 48 |
| 34 | Pushover | 2.016 | 1.960 | 2.061 | 27 to 43 |
| 35 | BadDivorce | 2.013 | 1.947 | 2.070 | 25 to 45 |
| 36 | StochasticPavlov | 1.998 | 1.946 | 2.060 | 26 to 48 |
| 37 | Thief | 1.998 | 1.932 | 2.048 | 29 to 53 |
| 38 | ZDExtort2 | 1.996 | 1.915 | 2.094 | 25 to 53 |
| 39 | AdaptiveBestResponse | 1.995 | 1.936 | 2.043 | 31 to 49 |
| 40 | FriendlySquare | 1.992 | 1.934 | 2.058 | 30 to 50 |
| 41 | ZDEqualizer | 1.992 | 1.923 | 2.042 | 31 to 53 |
| 42 | NeverSwitchUp | 1.979 | 1.856 | 2.131 | 23 to 58 |
| 43 | Illuminati | 1.976 | 1.912 | 2.024 | 32 to 55 |
| 44 | RandomStranger | 1.967 | 1.865 | 2.025 | 33 to 58 |
| 45 | HardMajority | 1.960 | 1.911 | 2.003 | 36 to 53 |
| 46 | RandomPrime | 1.960 | 1.869 | 2.031 | 34 to 57 |
| 47 | MrNiceGuy | 1.959 | 1.915 | 2.026 | 33 to 54 |
| 48 | BadCop | 1.958 | 1.875 | 2.022 | 33 to 57 |
| 49 | OneStepBehind | 1.952 | 1.877 | 2.001 | 36 to 56 |
| 50 | CooperativeProth | 1.951 | 1.875 | 2.004 | 35 to 56 |
| 51 | ImSoRandom | 1.943 | 1.879 | 2.045 | 29 to 55 |
| 52 | Lottery | 1.943 | 1.877 | 2.035 | 33 to 56 |
| 53 | MarkedMan | 1.940 | 1.902 | 1.974 | 40 to 53 |
| 54 | RitualDefection | 1.933 | 1.880 | 1.996 | 37 to 57 |
| 55 | SuspiciousTitForTat | 1.924 | 1.884 | 1.984 | 42 to 55 |
| 56 | Fibonacci | 1.920 | 1.776 | 2.057 | 28 to 59 |
| 57 | ParkBus | 1.885 | 1.838 | 1.936 | 51 to 59 |
| 58 | DefectiveFriedman | 1.854 | 1.812 | 1.915 | 53 to 60 |
| 59 | Pattern | 1.814 | 1.757 | 1.874 | 57 to 60 |
| 60 | BadJudgeOfCharacter | 1.785 | 1.704 | 1.861 | 57 to 60 |
The original all-strategies result file contains the exact ordered selection, settings, all 600 seed/strategy records, and summary statistics. Open it with Open result in the Robustness tab to explore the saved experiment without rerunning it. You can also download the ranked summary CSV, the individual seed records, or the figure-generation script.
Add mistakes and watch the rankings scramble
So far, every policy has executed its chosen move correctly. What happens when that assumption breaks?
I reran the full 60-strategy field with 1%, 10%, and 25% execution-error probabilities, keeping the same ordered selection, seeds 0 through 9, 100 rounds per match, one repetition, hidden horizon, and no self-play. Each intended move can flip independently: cooperation becomes defection, or defection becomes cooperation. Each new condition adds another 17,700 matches and 1.77 million pair-rounds.
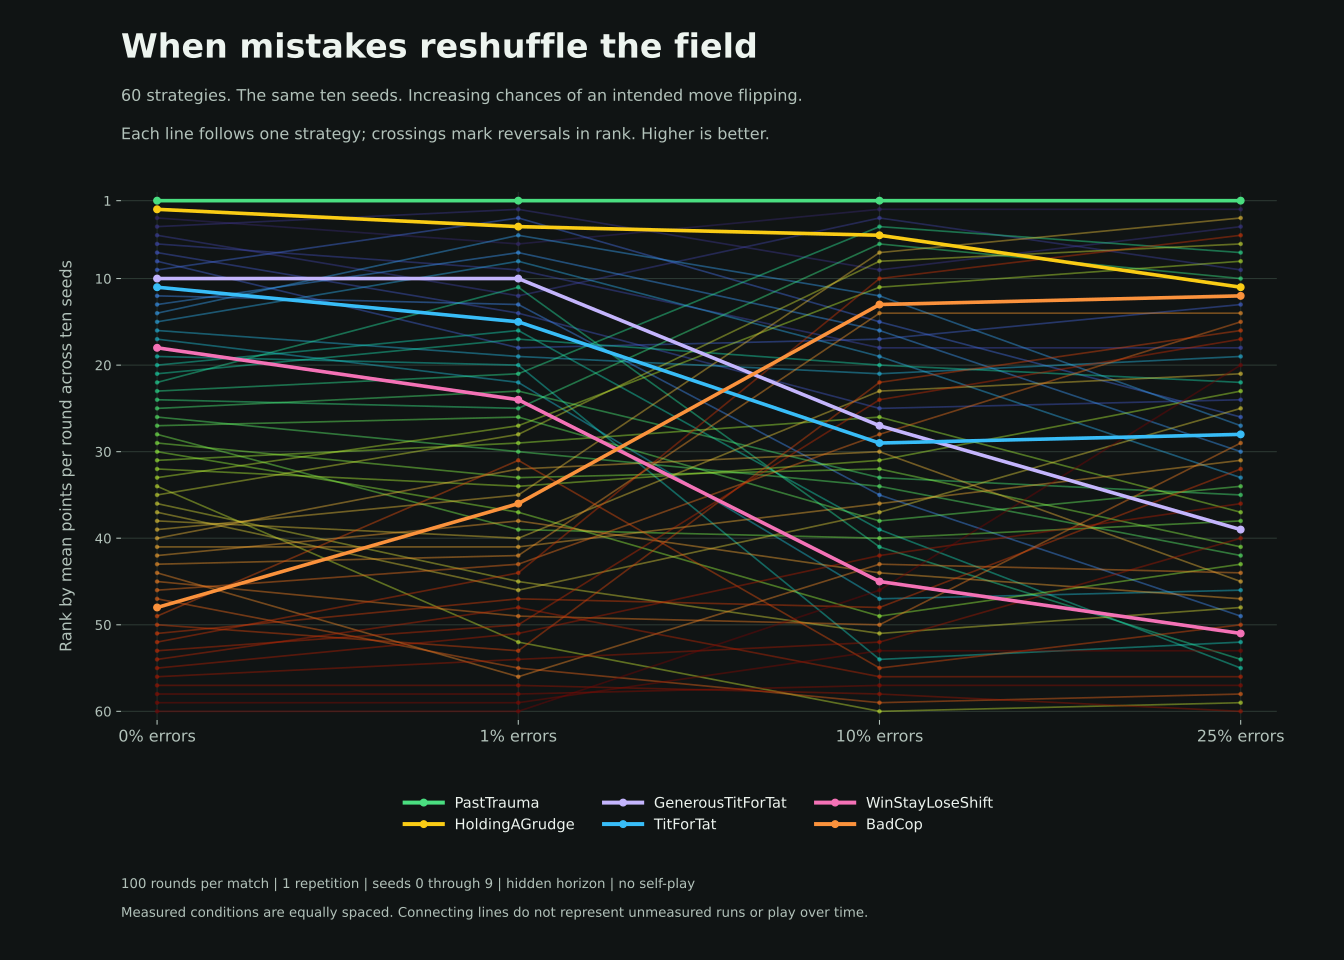
At just 1% errors, 53 of the 60 strategies changed rank. At 25%, BadCop had climbed from 48th to 12th, TitForTat had slipped from 11th to 28th, and WinStayLoseShift had fallen from 18th to 51st. The rule that performed well under reliable execution could lose its advantage when actions became unreliable.
| Strategy | 0% errors | 1% errors | 10% errors | 25% errors |
|---|---|---|---|---|
| PastTrauma | 1 | 1 | 1 | 1 |
| HoldingAGrudge | 2 | 4 | 5 | 11 |
| TitForTat | 11 | 15 | 29 | 28 |
| GenerousTitForTat | 10 | 10 | 27 | 39 |
| WinStayLoseShift | 18 | 24 | 45 | 51 |
| BadCop | 48 | 36 | 13 | 12 |
These are ranks by mean points per round across ten seeds, using full precision. Moving up the ranking does not necessarily mean earning more points: other strategies may simply have lost more ground.
There is still structure inside the tangle. PastTrauma stayed first at every tested error rate. Average cooperation across the field fell from 47.9% without execution errors to 42.9% at 10% errors, then rose to 45.0% at 25%. Mistakes can create accidental cooperation as well as accidental defection, so increasing the error probability does not guarantee a steady decline in cooperation or payoff.
This is the sense in which the experiment starts to look chaotic: many interacting rules, unreliable actions, and a ranking that changes as the conditions change. These results do not establish mathematical chaos or prove that every small perturbation produces a large effect. They show why I would test a policy’s behavior under mistakes before trusting its clean-run ranking.
The seeds identify reproducible runs within each condition. The batch engine shares its random stream between policy randomness and execution errors, so reusing a seed across error settings does not hold every policy’s random choices fixed. This comparison describes whole tournament outcomes under each setting; it does not isolate the effect of one particular flipped move.
To inspect the captured runs, open the original 1% result, 10% result, or 25% result in the app’s Robustness tab. The complete comparison CSV, field averages, and figure-generation script are also available.
Preserve enough context to repeat the experiment
A seed is only part of a reproducible experiment. The selected strategies and their order, match length, repetitions, horizon visibility, error settings, custom rules, and implementation version also matter.
There is an additional detail in this project: the live tournament and batch engine used by Robustness use different random generators. A matching seed does not promise an identical stochastic trace across those execution modes. Reproduction needs to use the same mode and implementation.
The two small tournament examples here use deterministic policies and zero execution errors, which keeps their ranking change easy to explain. For experiments involving mistakes, the app can separately flip intended actions with a configured execution-error probability and record what actually happened. That provides a way to investigate recovery from mistakes while distinguishing them from a policy’s own randomness.
You can inspect or repeat the captured experiments using these files:
- Three-strategy tournament configuration, imported with Import experiment in the Strategy Lab.
- Six-strategy tournament configuration, imported the same way.
- Ten-seed sweep result, opened with Open result in the Robustness tab. Opening the saved result inspects it without rerunning the sweep.
The captures use the live app reporting version 1.5.0. Source references in this article are pinned to commit d2d1987. The live version endpoint did not expose its deployment commit, so that source revision should not be read as a verified identifier for the captured deployment.
What I take from these experiments
This is a small model with a fixed payoff matrix, explicit policies, and a selected set of opponents. Applying it to a real decision would require checking whether those assumptions represent the situation well enough.
The useful habit transfers to other engineering work: define the objective, make the assumptions visible, compare alternatives, inspect the interactions, and vary the conditions that could change the conclusion.
Before choosing a strategy, I want to know what supports its apparent advantage and how easily that advantage disappears. Building this simulator gives me a concrete way to ask those questions.
Try the simulation · Explore the source · Read the project case study