Project
Ticker Tracker
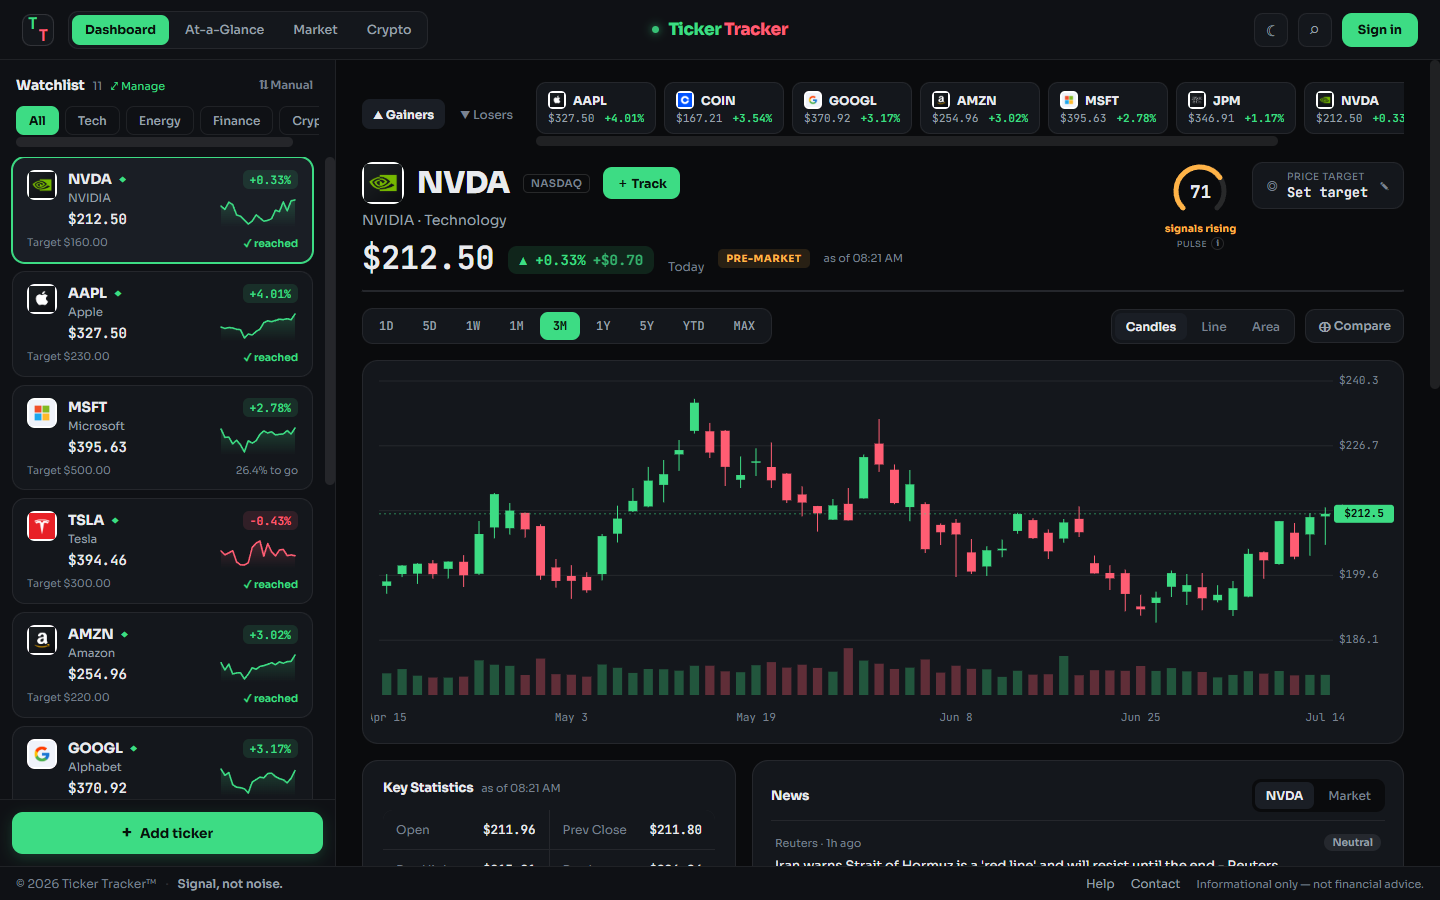
Ticker Tracker is a live financial dashboard with candlestick charts, a proprietary momentum score, analyst ratings, sentiment-tagged news, and a crypto heatmap. The visible product rests on a more important engineering decision: treating free, unofficial market-data sources as dependencies that will eventually fail.
| Project detail | Value |
|---|---|
| Role | Sole designer and developer |
| Timeline | September 2024 to present |
| Product | Full-stack personal finance application |
| Data foundation | Python, dual-source failover, parallel fetching, validation, and caching |
| Status | Live at tickertracker.info |
Project snapshot
- The challenge: Track markets without paying for a commercial data feed, while relying on free sources that can break without warning.
- My role: Data pipeline, backend, frontend, product design, and deployment.
- The approach: Treat the data layer as hostile and place failover, retries, validation, and caching between unreliable sources and the interface.
- The solution: A live dashboard with three chart modes across nine timeframes, a proprietary Pulse momentum score, analyst consensus, sentiment-tagged news, an at-a-glance table, and a live crypto heatmap.
- The outcome: A public product that has survived multiple upstream API changes that broke the original script. Formal reliability metrics have not yet been instrumented.
From script to resilient product
Ticker Tracker began in September 2024 as a Python script that printed stock prices. It kept breaking, not because the core logic was complex, but because it depended on yfinance, an unofficial wrapper around Yahoo Finance. Endpoint changes, library regressions, and silently corrupted local caches could each stop every request.
Rather than abandon free data, I rebuilt the project around the assumption that the data layer will fail. The current pipeline fetches every ticker in parallel, tries yahooquery first, falls back to yfinance with retries, validates values before display, and caches results server-side.
That foundation supports the application now live at tickertracker.info: interactive candlestick, line, and area charts across nine timeframes; a proprietary Pulse momentum score with a transparent calculation breakdown; analyst-rating consensus and 12-month price targets; sentiment-tagged news; key statistics and company profiles; a sortable summary table; and a crypto heatmap in both dark and light themes.
The context
I wanted one glanceable answer to a daily question: where are my holdings relative to the point where I would act? Brokerage applications often bury that context beneath portfolios, promotions, and upsells. Market-data APIs with contractual reliability cost more than a personal project can justify.
The free alternative is powerful but carries no service-level agreement, advance notice of endpoint changes, or support channel. Ticker Tracker therefore needed to earn trust through defensive engineering rather than through the reliability of a vendor.
The challenge
The core problem was building a real-time dashboard on top of data sources with no reliability guarantees.
Three concerns shaped the work:
- Upstream instability. A dashboard that shows errors, or worse, silently wrong prices, is less useful than no dashboard.
- Latency versus rate limiting. Sequential requests make a full watchlist slow, while uncontrolled concurrency risks upstream throttling.
- Data quality. Scraped sources can return empty frames, stale values, or implausible numbers. A financial interface cannot display them without validation.
The original script had none of these defenses. When its single source worked, the script worked; when that source changed, the product stopped.
Goals and constraints
The primary goal was to make price, trend, and range context available for an entire watchlist in one glance. A single ticker failure, or the failure of one complete source, could not be allowed to take down the dashboard.
Users also needed to manage the watchlist from the interface, understand whether the market was open, and move from a quick scan to deeper research without leaving the application. Trade execution and brokerage integration were intentionally excluded; this is a monitoring and research tool, not a trading terminal.
The zero-dollar data budget dictated the reliability strategy. Solo, part-time development favored simple and observable constructs over premature infrastructure. Public hosting added its own constraints around environment-based configuration, host and port binding, path resolution, and startup order.
Research and discovery
Discovery came from daily operation and failure forensics rather than formal user interviews.
- Logs grouped failures into empty responses, exceptions caused by changed endpoints, and corrupted local caches that poisoned every subsequent request.
- Testing
yahooqueryrevealed a second client that failed at different times and in different ways fromyfinance. - An early assumption that retries would solve the problem proved incomplete. Retries help transient failures; failover and validation are necessary for systemic ones.
Key insight
The interface is not the hard part. The reliability layer is. Charts and tables are the visible product, but the durable value is the pipeline that turns two unreliable sources into one useful feed.
Reliability strategy
The implementation treats every external request as likely to fail and defines its fallback before it happens.
- Failover based on observed behavior:
yahooqueryis attempted first andyfinanceserves as the secondary source. Each path also degrades internally, using a shorter history window if a full-history request fails. - Parallelism with a bounded blast radius: A
ThreadPoolExecutorfetches the watchlist concurrently with per-ticker timeouts. One stalled symbol costs one row, never the page. - Validation before display: Price series must be non-empty, positive, and below an implausibility threshold. Corrupted data is dropped rather than rendered.
- Caching for speed and courtesy: A short server-side cache makes repeat views immediate and limits requests to the upstream services. Watchlist changes invalidate it immediately.
The alternatives were deliberately limited. Commercial APIs conflicted with the budget, threads were simpler than an asynchronous rewrite for this workload, and transparent file persistence remained sufficient for the current scope.
How requests survive failure
- The application requests a ticker from
yahooquery. - An empty or failed response moves the request to
yfinance. - The fallback receives up to three bounded attempts.
- Returned data passes through sanity validation.
- Valid results enter the short-lived server cache and reach the interface.
- Invalid results are omitted without interrupting the remaining watchlist.
Every layer between the browser and the source exists to absorb a failure observed in the running application.
The live product
Ticker detail
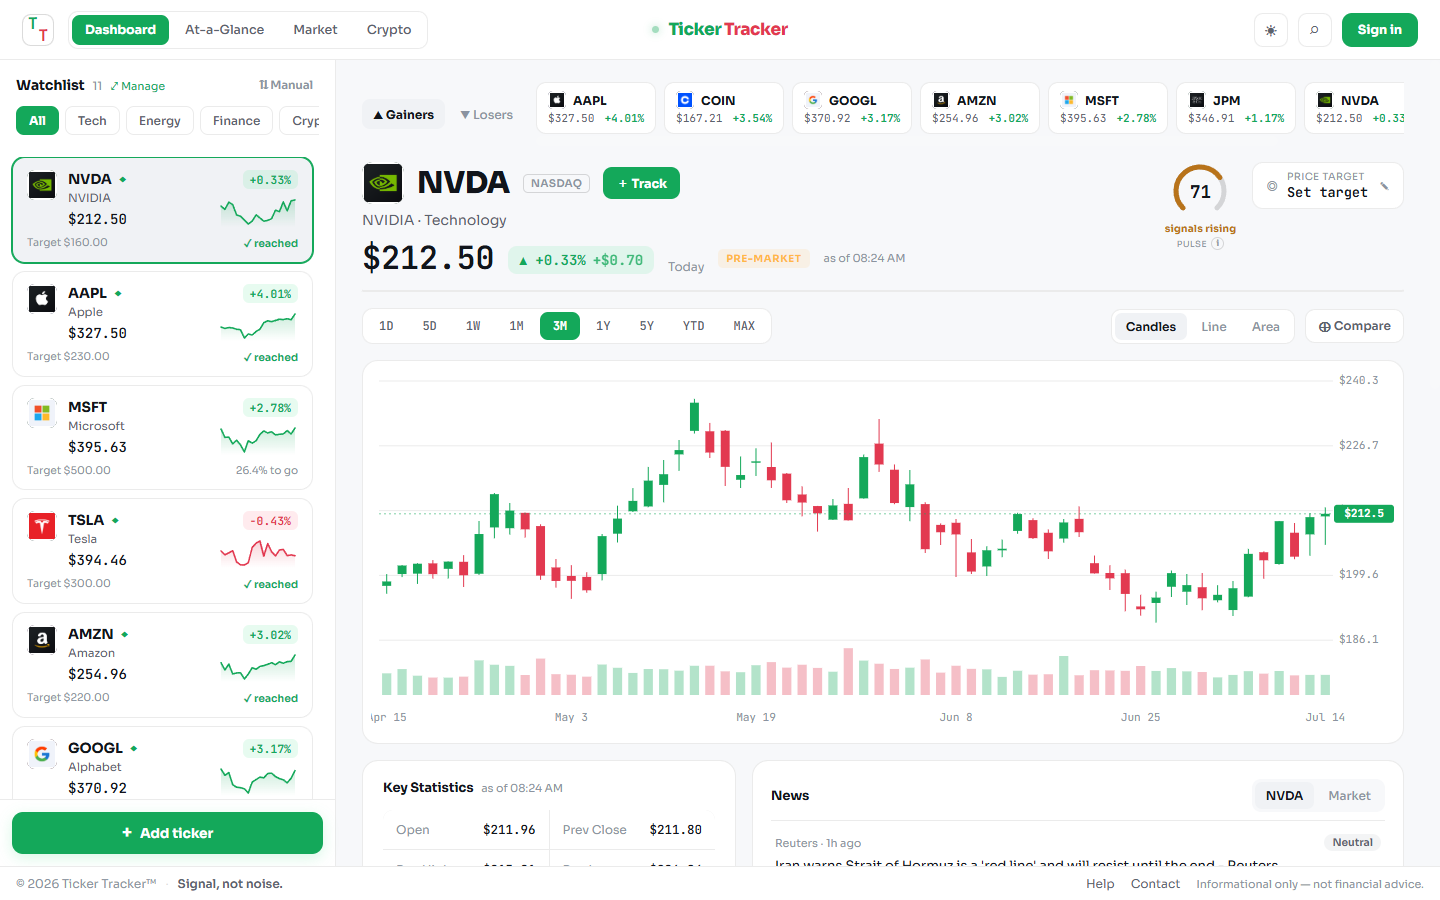
The main dashboard provides candlestick, line, and area charts across nine timeframes, from one day through maximum available history. A volume subchart, live market-status indicator, watchlist sparklines, and one-click price-target control keep the primary research context together.
The proprietary Pulse score summarizes momentum on a 0-100 scale and includes a “see the math” breakdown rather than presenting an unexplained rating.
Fundamentals and context
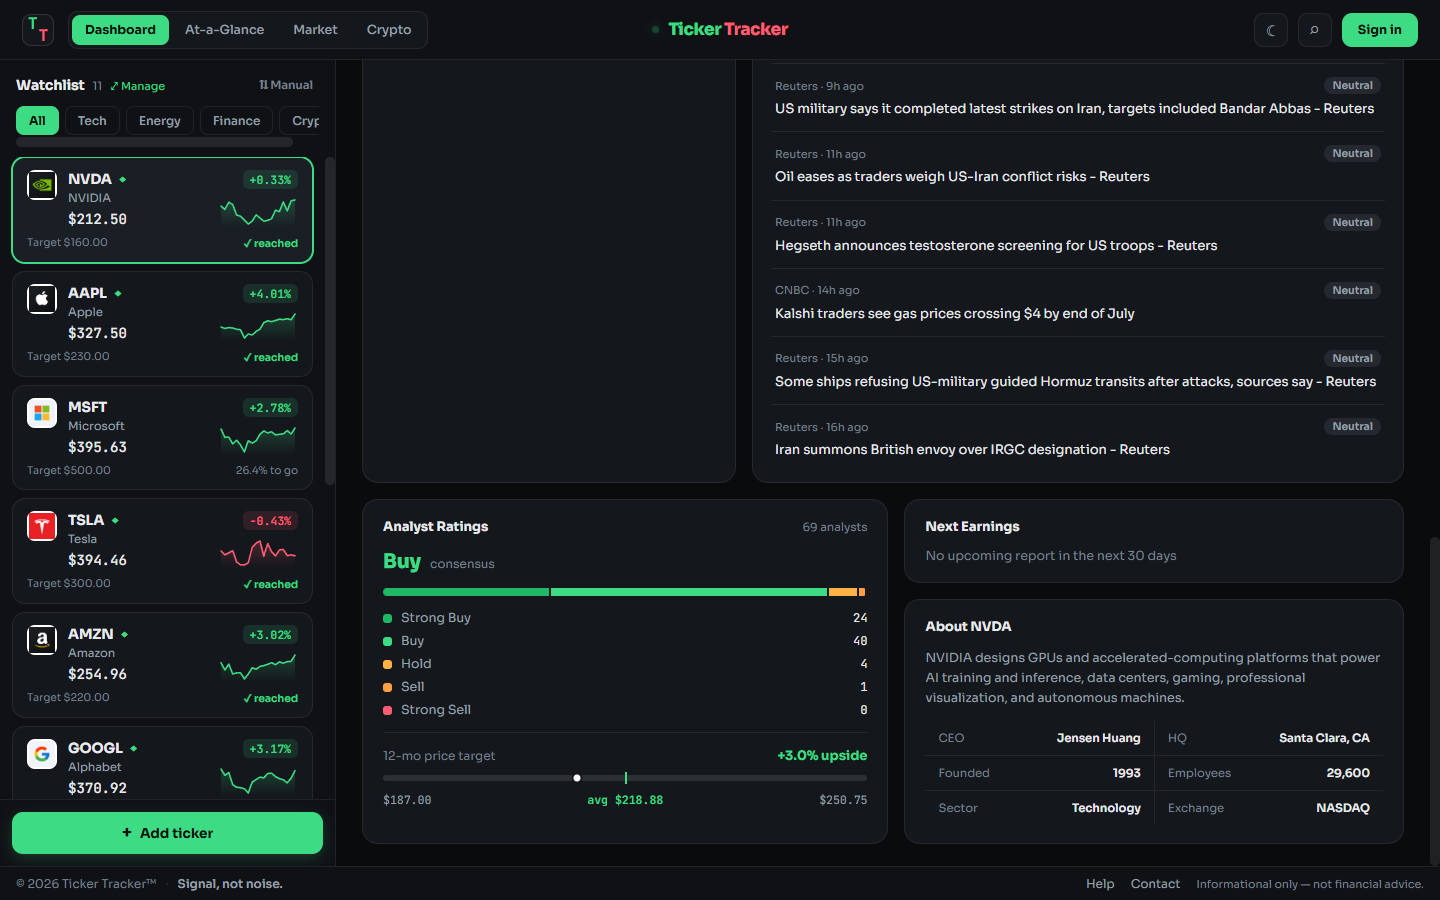
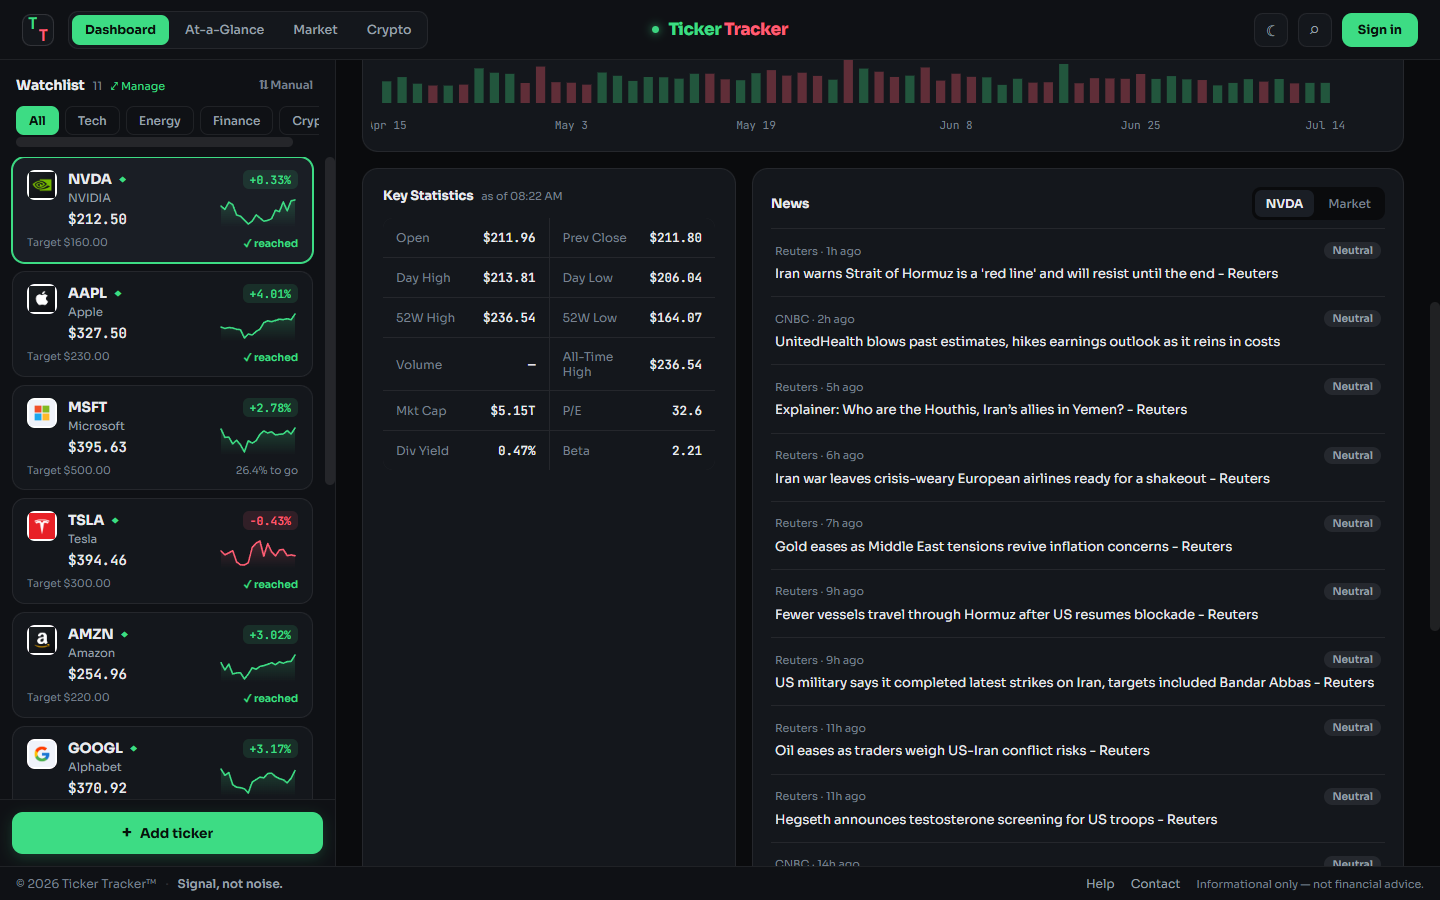
The research view combines opening price, daily and 52-week ranges, market capitalization, price-to-earnings ratio, dividend yield, and beta with analyst-rating distribution, a consensus verdict, a 12-month price target, sentiment-tagged news, earnings status, and company profile.
At-a-glance watchlist
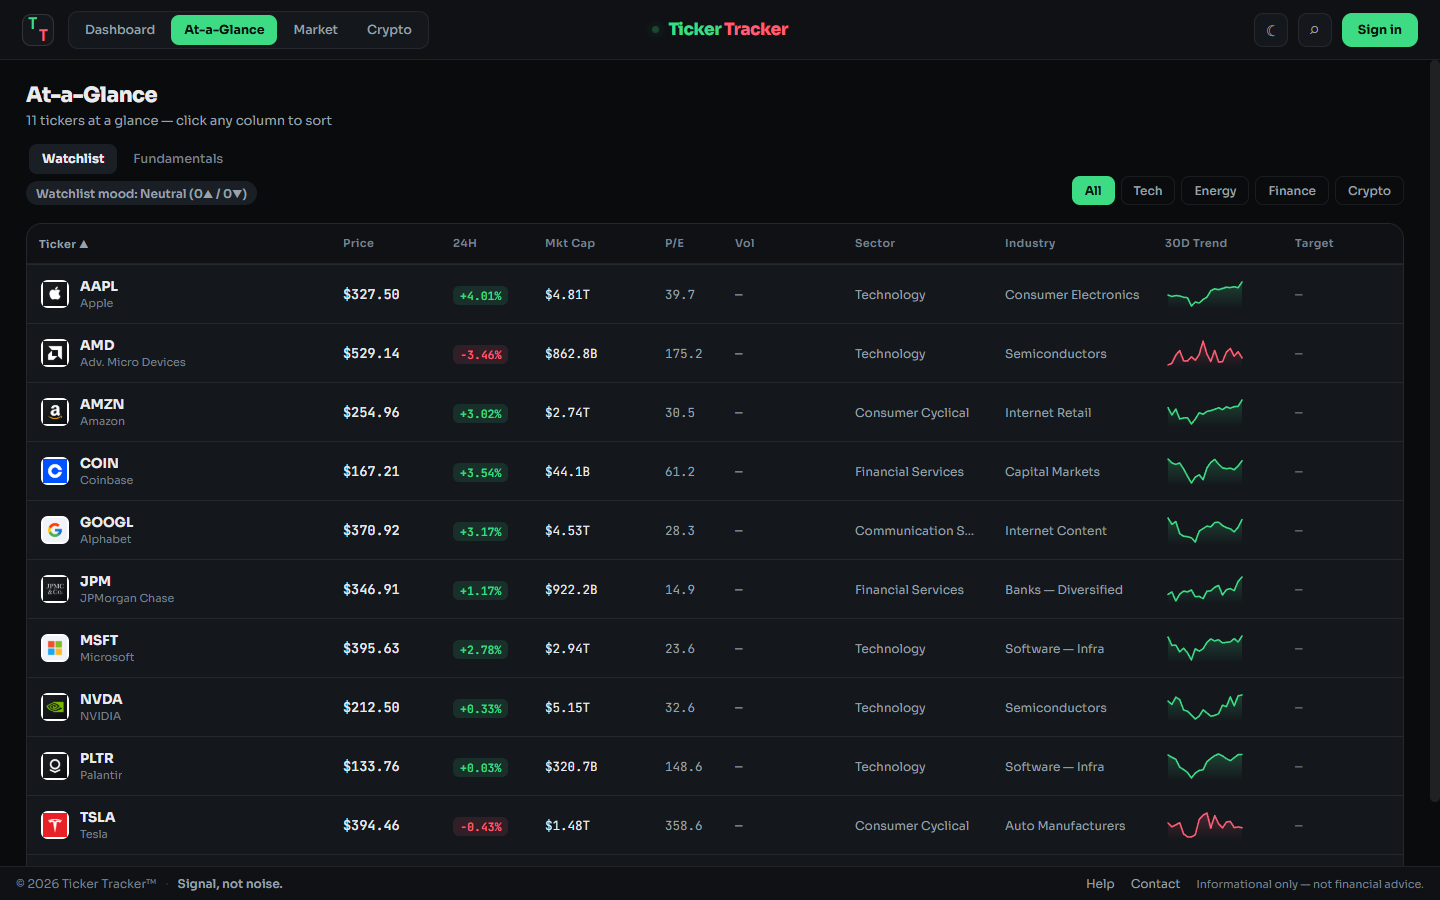
A sortable table presents each holding’s price, daily change, market capitalization, valuation, sector, industry, 30-day sparkline, and target progress. Category filters narrow the table to technology, energy, finance, or cryptocurrency.
Crypto market view
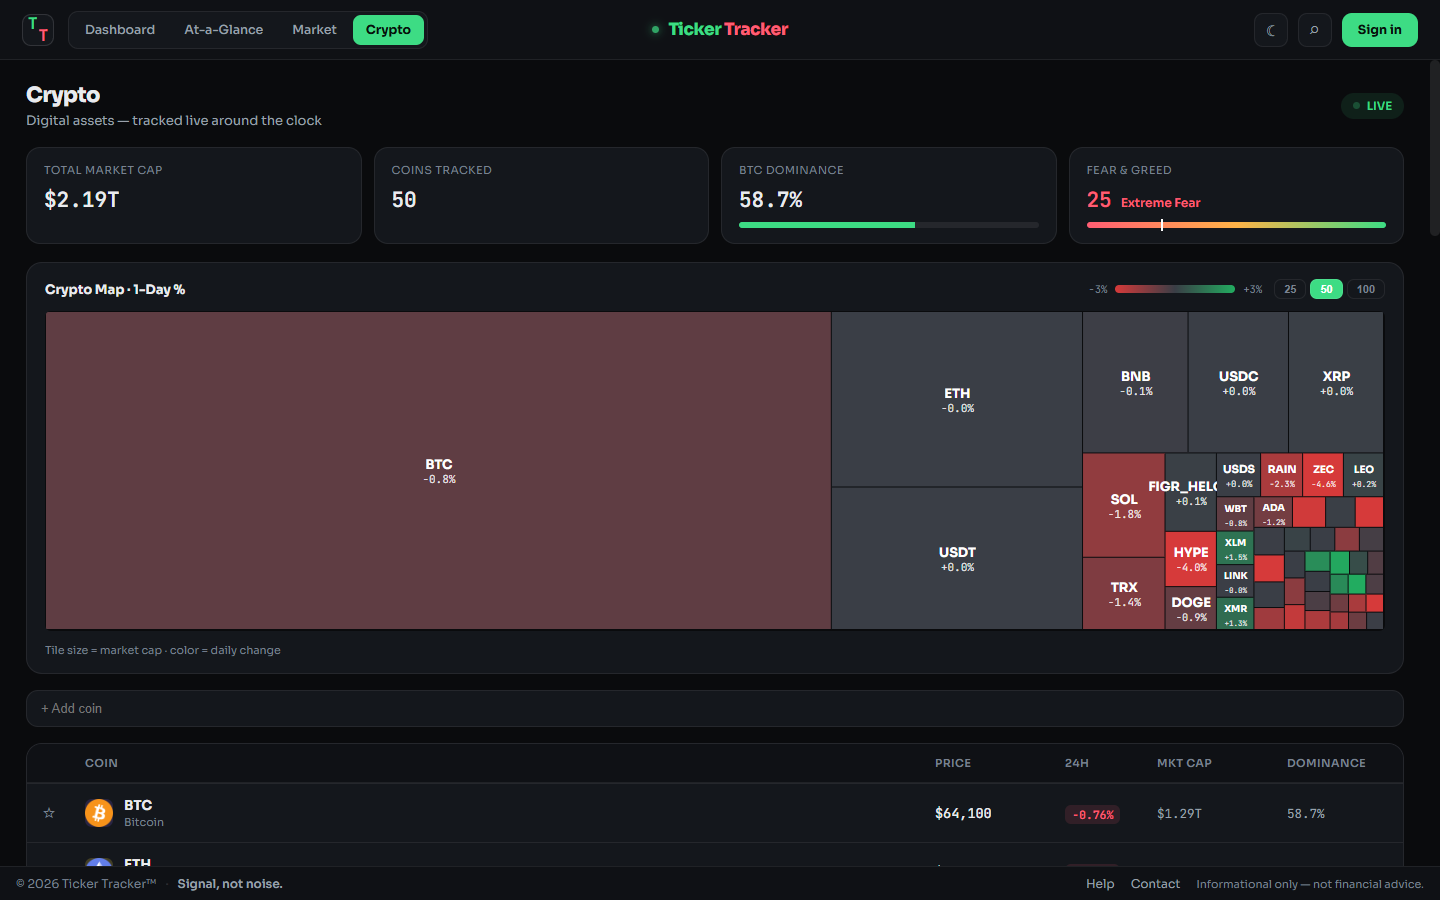
The crypto view maps 50 assets into a treemap where area represents market capitalization and color represents daily movement. It adds total market capitalization, Bitcoin dominance, and a Fear and Greed gauge for broader context.
Dark and light themes
Theme support is applied across every view, including charts and dense data tables, rather than stopping at page chrome.
Development phases
- Script era, September 2024: A terminal script with price-target alerts proved the idea and exposed the fragility of a single data source.
- Reliability rebuild, March 2025: Parallel fetching, dual-source failover, retries, validation, and caching established the durable pipeline.
- Product layer, 2025-2026: Candlestick charts, Pulse, analyst ratings, sentiment news, the summary table, crypto heatmap, and theme support turned the pipeline into a complete application.
- Public deployment, 2026: Shipping to
tickertracker.infoexposed path, initialization-order, and host-binding bugs that did not appear locally.
Challenges and tradeoffs
Corrupted caches
The yfinance cache could become corrupted and fail every request until manually deleted. The application now clears the affected cache directories before fetch cycles. This slightly slows cold requests but automates recovery from a failure that previously required intervention.
Freshness versus politeness
Continuous polling would create unnecessary upstream traffic and invite throttling. A short cache accepts slight staleness in exchange for fast repeat views and responsible request volume. Immediate invalidation after watchlist changes protects the moments when freshness matters most.
Deployment reality
Public deployment surfaced bugs hidden by the local environment, including working-directory assumptions, initialization order, and host/port binding. “Works locally” became a hypothesis to verify rather than a completion criterion.
Honest scope
The Market Overview currently uses simulated index and sector data and labels it accordingly in the application. Live index quotes remain planned. The dashboard, fundamentals, at-a-glance table, and cryptocurrency views use live data.
Results
The primary outcome is a public dashboard that has remained functional through upstream changes that stopped the original script. Reliability rates have not yet been formally instrumented, so the case study does not claim uptime or failover percentages.
Verified capabilities include:
- Two independent data clients combined into one pipeline with per-result source attribution
- Concurrent watchlist fetching with per-ticker failure isolation
- Candlestick, line, and area charts across nine timeframes
- Pulse momentum analysis, analyst consensus, and sentiment-tagged news
- A live heatmap covering 50 cryptocurrency assets
- Complete dark and light themes
- Public deployment at tickertracker.info
| Dimension | Original script, 2024 | Live product, 2026 |
|---|---|---|
| Interface | Terminal output | Charts, ratings, news, heatmap, and sortable table |
| Data source | yfinance only |
Dual-source failover and validation |
| One ticker fails | Script may stop | One row is omitted; the page continues |
| Charting | None | Three chart modes across nine timeframes |
| Analysis | Raw prices | Pulse score, analyst consensus, and sentiment news |
| Runtime | Local machine | Public domain with dark and light themes |
Fetch latency improvement, failover frequency, uptime, and cache-hit rate remain unmeasured. Instrumenting those values is the most important next step.
Lessons learned
- Uncorrelated unreliability can compose into reliability. Two imperfect sources with different failure modes are more resilient than dependence on one apparently better source.
- Diagnose before defending. Initial retry logic addressed transient errors but not systemic source failures. Log analysis should precede resilience design.
- Validation is a feature in data products. Missing data is acceptable; confidently displaying a corrupted financial value is not.
- Deployment is a test suite. Path and startup-order defects were invisible locally and immediately consequential in production.
Reflection
The reliability foundation is the part I value most because it separates a visual demonstration from a product I trust enough to operate publicly. The most difficult work involved proving that failures originated upstream, then designing around them rather than merely reacting to them.
If I rebuilt the project today, I would instrument it from the beginning with counters for source failures, failovers, cache hits, and request latency. The largest weakness in this case study is evidence the application could have collected automatically.
This project permanently changed how I evaluate dependencies. I now ask “how does this fail?” before asking “what does this do?”
Next steps
- Immediate: Add fetch, failover, and cache metrics; replace simulated Market Overview data with live index and sector quotes.
- Medium term: Add server-sent or WebSocket updates, per-ticker alert history, and configurable alert direction.
- Long term: Introduce pluggable data-source adapters so additional sources can join the failover chain without changing pipeline logic.